The Comeback of Streetcars

By: Michael Tylka

https://i0.wp.com/www.railwaypreservation.com/vintagetrolley/Tampa_advertising_cars.JPG
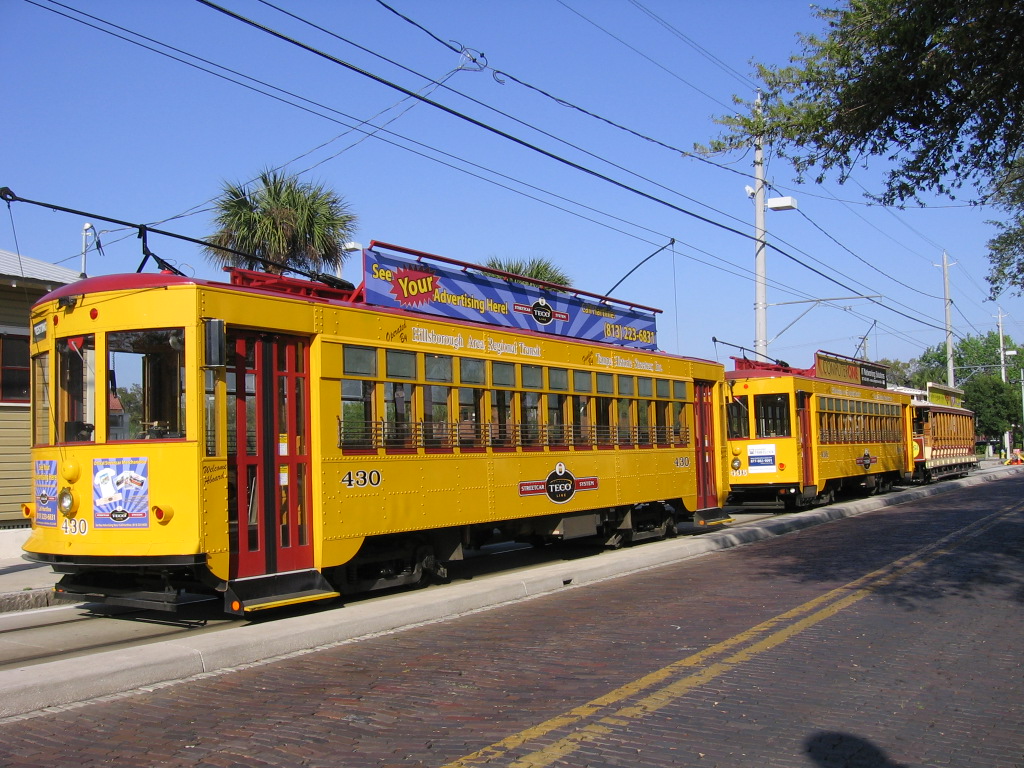
Tampa Streetcars (http://www.railwaypreservation.com/vintagetrolley/Tampa_advertising_cars.JPG)

Many cities in the United States are reintroducing the streetcar as a tool to aid in the revitalization of urban cores. Questions can be asked in regards to their usefulness in a comprehensive transportation network, the level of benefit to economic development they provide, and their use in transit oriented development with the goal of increasing density. Streetcars are different than light rail as they coexist with traffic on city streets. Historically most cities in the nation had significant networks until automobile use skyrocketed and the creation of the interstate highway system. Attention to streetcars as part of a conversation on transportation and land use is warranted as city’s view them as a way to use transit to alter land uses and the urban form.

Those that sell the idea of modern streetcars mention benefits in terms of job growth, neighborhood reinvestment, environmental impact, connectivity/mobility, property values, and usefulness in combating congestion and raising travel costs. It has been stated by proponents of projects that the permanent nature of lines will lead to development and thus the above mentioned benefits. The argument here is that developers only feel comfortable making large investments along infrastructure networks that they feel are not going to go away. Bus rapid transit lines are significantly cheaper and I do not see why people would not view these as just as permanent. Part of me thinks that people simply like the appeal of streetcars as testament to days gone by and their historic nature, and not to forget the average American’s dislike of buses.

Robert Cerervo, a renowned transportation expert, has stated that streetcar usage is a vital part of a larger transportation network as streetcars can be used as circulator routes. In this the lines exist in the dense urban cores and people would most likely have to take another form of transit to get to the line if they did not live along the route or in the core. This is the type of network Cincinnati, Ohio is looking to build. I do question the idea that people are willing to take multiple forms of transportation in a mid-size city where one can easily find a place to park. If the line is not the most convenient option than why would the masses take them? Perhaps if the line does lead to further densification, the highest and best usage of land will not be for parking, and then we can look to see it being easier for a person to use the street car as a circulator. Toronto, Ontario is an example of a city that uses its streetcar network in conjunction with its light rail network and bus system. It makes virtually any area of the city quite accessible as the connectivity is expansive, but like earlier stated, this is a large city where parking and driving is inconvenient.

Map of Cincinnati Line Currently Under Construction – This displays that the line runs only in the urban core with plans to eventually connect to a college neighborhood – http://www.cincinnati-oh.gov/streetcar/design-route/

Cincinnati Streetcar route map
Economic development provided by an expanded transportation system is key to arguments for new systems. Critics of projects look to expose costs and other funding mechanisms used. Randal O’Toole in a report prepared for the John K. MacIver Institute for Public Policy points to tax breaks, subsidizes, and city investment along routes as the real reason behind development for the Portland, Oregon line. O’Toole is clear in stating that he feels streetcars are “long-obsolete technology”.(1) Also in Portland, O’Toole points to the use of TIF, tax increment financing, for projects and how this particular project only used $21 million of the $725 million of bonds for streetcar construction.(2) The money here was spent to improve other aspects of the districts and in stating this O’Toole is pointing to the fact that perhaps projects are being approved when the public is not fully informed who is benefiting from funding dollars. He feels that people like roads and cars therefore that is where money should be spent. In this he is only taking the initial construction costs, and not all the other benefits of mass transportation.

The City of Tucson, Arizona has a streetcar network that is often presented as a model for other cities. Their line runs between downtown and a major university campus. The Downtown Tucson Partnership claims that around 150 businesses have opened along the route and that approximately 2,000 jobs have been created.(3) One must ask if the line is the main reason for the revitalization and not other factors at play. Certain places such as this have large bodies of young people that are willing to ride between two particular locations. Cities must be careful in placing lines as not all cities will have populations such as this that are open to riding this form of mass transit and ones that are so concentrated.

Luckily for streetcar enthusiasts, the Obama administration in 2010 offered $130 million in federal funds for street car projects.(4) Detractors state that yes the lines may create jobs, but that the major concern is that the lines will require financial assistance for their entire lifetime.(5) The overwhelming majority of all forms of public transit are supported by governmental or private investment. The basic question here should be does that assistance create a positive return that is multiplied to the community. This should be answered by city officials before any streetcar lines are considered to be a viable option.

Streetcars should be considered as an option as part of a larger transportation network if their benefits are able to quantified. Yes it is difficult to know exactly the extent of their reach, but I would caution any city before near permanent expensive infrastructure is put in place. If lines truly are shown to bring people into urban cores than yes they could help in densification and in turn the repopulation of downtowns and blighted areas.

Works Cited:

[1] Randal O’Toole. The Streetcar Scam. MI Reports, prepared for The John K. MacIver Institute for Public Policy. http://object.cato.org/sites/cato.org/files/articles/streetcarscam-otoole.pdf

[2] Randal O’Toole. The Streetcar Scam. MI Reports, prepared for The John K. MacIver Institute for Public Policy. http://object.cato.org/sites/cato.org/files/articles/streetcarscam-otoole.pdf

[3] Daniel C. Vock. Cities turn to streetcars to spur economic development. November 8, 2013. http://www.usatoday.com/story/news/nation/2013/11/08/stateline-streetcars/3475007/

[4] Katherine Dorsett. Can streetcars save America’s cities? December 17, 2010. http://www.cnn.com/2010/US/12/17/light.rail.streetcar/

[5] Katherine Dorsett. Can streetcars save America’s cities? December 17, 2010. http://www.cnn.com/2010/US/12/17/light.rail.streetcar/

How to make a successful Transit-Oriented Development: a comparative cases study

What is TOD?

Transit Oriented Development, shorten to its acronym TOD, is valued by urban planners, which includes mix land use located within a certain walkable area around transit nodes.  It gains increasing attraction because it is believed that TOD can provide more opportunities for jobs, housing, and commerce.

Generally, TOD is considered to include these benefits to the neighborhoods but no limit to:

  • Reducing private vehicles trips
  • Increasing transit ridership
  • Improving walkable in surrounding neighborhoods
  • Adding value to nearby properties
  • Providing better access to jobs
  • Creating more opportunities to local business
  • and Environmental friendly.

TOD in Hong Kong

Hong_Kong_Skyline_viewed_from_Victoria_Peak

Figure1 Vitoria Bay, Hong Kong

(Sources: Haydn Hsin)

The city of Hong Kong located in the south of China, known as a harbor city.  The Hong Kong 2014 mid-year estimate presents that the population of Hong Kong residents is 7,234,800, and the density is approximately 16,983 people per square miles. The city of Hong Kong is one of the densest cities in the world that always faces the problem of traffic congestion, tight housing market and environment issues. Accordingly, nearly 68% of workers in Hong Kong took the public transit to their workplace (Cho-Yam, 2010). Public Transit plays an important role in the city to help solving these problems, and even to  attract more people to the city (the population is continuing growing in Hong Kong). The Mass Transit Rail Corporation (MTR), the major organization operating Hong Kong’s metro system, was government-owned and now becomes private. Since millions of people use the railway for daily commuting, the MTR has a strong political and economic impact on the whole city (Bukowski, Boatman, Ramirez, & Du, 2013).

Why TOD can be successful in Hong Kong?

Although it is expected that TOD can promote local business while solving traffic problems, TOD doesn’t always success, for example the Douglas Road transit station in Coral Gables failed. Therefore, why TOD can be successful in Hong Kong?

  1. TOD requires high density and mix land use development.

There are 68% of workers using transit to get access to the place of work, the millions of people promote the market surrounding the transit nodes. Also, the large number of commuters create the demand for retails around the station. For example, a white collar worker is on his way to work, he will probably buy his breakfast and newspaper in the retail stores inside the metro station or near the bus stop; when he is on his way back home, it is possible that he will buy some food or some general merchandise in nearby stores. How to increase transit ridership, making people use transit instead of automobile? One way is to increase the walkability in the neighborhood, and this requires mix land use. The mixture might include residential, commercial, office, health, public areas and etc. It can vary cases by case, Figure 2 shows the mix land use within 500 meters of Hang Hau Station.

Hang Hau station

Figure 2 Hang Hau station and buildings within 500-metre catchment

(Source: Urban Studies)

  1. Transit should be more competitive than automobile.

If TOD can provide better access to work, recreation, shopping, then people will choose transit as the major travel mode. First of all, in Hong Kong, it is convenient to take a metro to office areas, famous attractions and large shopping malls. Second, traffic congestion is a normal issue in Hong Kong, hence workers have to take the metro to make sure they can arrive workplace on time. Third, in Hong Kong, it is difficult to find a parking lot near some shopping spaces, and the fare of parking is very high at some areas. All these above make transit is more competitive than automobile. Most residents of Hong Kong who own a car will still choose transit as the major commuting mode in weekdays.

metro

Figure 3 Hong Kong Metro Map

(Sources: MTR)


  1. TOD needs the support from government.

Hong Kong Government makes a great effort on transit development. Although MTR is now a private corporation, the government still owns a portion of the corporate stock (Bukowski, Boatman, Ramirez, & Du, 2013). The government gives a priority to TOD and makes the development runs as smooth as possible. Also, the government politically limits the private car use by constraining parking spaces, rising parking fee, and lowering the transit fare. This policy will force drivers shift to public transit.

TOD in Boston

Obviously, Boston is one of the busiest cities with the population of 617,594, and density of 12,792.6 (Census 2010). Different from the city of Hong Kong, Boston maintain its traditional neighborhoods and use small, subtle tools to make the TOD fit into the area (TCRP Report 102). The development of TOD in Boston also proves the conclusions mentioned in Hong Kong case.

  1. TOD needs a strong market

Boston is a city that attracts people all over the world. Every year, a large number of migrants rushed into the city to find a job and settled down in the city. The demand of public transit increased transit ridership and promoted the local housing, labor, and commercial market. Figure 4 presents that the Future World Trade Center Transit Stop was designed as a High-Density, Pedestrian-Oriented area.

The future

Figure 4 the design of the Future World Trade Center Transit Stop

  1. TOD requires support from different organizations

The national Trust for Historic Preservation’s Main Street Program made the residents, merchants, and nonprofit institutions work together, and thus produced new business, jobs, commercial and residential buildings. When the TOD focused on revitalizing retail centers in rail-served neighborhood, this Main Street Program offered all the basic services, and helped Boston maintain a housing/jobs balance (TCRP Report 102: Transit-Oriented Development in the United States: Experiences, Challenges, and Prospects, 2004). Figure 5 shows that the Main Street program in Roslindale Village Neighborhood helped improve the appearance of store and pedestrian infrastructure, and thus promoted the business near bus stops.

Main Street

Figure 5 Main Street in Roslindale Village Neighborhood.

(Source: TCRP Report 102)

In Boston, the development involved zoning, infrastructure improvement, guidelines, permissible use, and etc. It is no doubt that all these process need the support from different organizations.

Conclusions

From the cases from Hong Kong and Boston, we can draw the conclusion that although TOD has lots of benefits, not every city is suitable for this kind of development.It needs high density, mix land use, appropriate transit plan, and political and financial support from government.

References

Benfield, K. (2013, March 11). An Epic Transit-Oriented Development Fail. Retrieved from City Lab: http://www.citylab.com/design/2013/03/epic-transit-oriented-development-fail/4932/

Bukowski, B., Boatman, D., Ramirez, K., & Du, M. (2013). A Comparative Study of Transit-Oriented Developments in Hong Kong. Hong Kong.

Cervero, R., & Murakami, J. (2009). Rail and Property Development in Hong Kong: Experiences and Extensions. Urban Studies, 2019-2043.

Cho-Yam, J. L. (2010). Public transport and job-seeking range of the poor in older urban districts in Hong Kong. Habitat International, 406-413.

Mid-year Population for 2014. (2014). HongKong: Census and Statistics Department.

TCRP Report 102: Transit-Oriented Development in the United States: Experiences, Challenges, and Prospects. (2004). Washington, D.C.: Transportation Research Board.


To Walk or Not To Walk: Does the Built Environment Really Matter?

I have been doubting that the built environment is the dominant factor that predict walking and cycling behavior. While I admit that it does have a certain effect, the magnitude might not be as high as we thought. In this post, I will review some related research that confirm the highly impact of the attitudinal factor on active transportation, and summarize solutions to control this factor to encourage walking and cycling in communities that are unfamiliar with active transportation.

Do people who live in walkable neighborhoods walk more?

New Urbanism has long been considered to have a positive effect on inducing walking. This idea of creating a walkable, mixed use neighborhood with narrow streets and well-design streetscape is adopted in many cities with the hope to get people out of the cars and use non-motorized modes. In fact, many studies prove that residents of walkable neighborhoods tend to walk more than those who live in suburban, auto-oriented neighborhoods (Frank et al., 2007, Lund, 2003).

However, one factor was missed in many studies on the effect of built environment on travel behavior. Handy et al. (2006) pointed out that self-selection has a strong effect on travel outcomes. Specifically, people who have a positive attitude towards walking tend to locate in walkable neighborhoods and take advantage of the walkability. After controlling for self-section, the built environment is shown to have a less significant, or even insignificant impact on travel behavior in many cases.

To test whether or not a walkable environment induces more walking in people who have a negative attitude towards walking, Joh et al. (2012) conducted a study in eight neighborhoods in the California South Bay area. They found that those who have a neutral or negative attitude towards walking are more hindered by the fear of crime and show no impact from the walkable setting on walking. Even the number of four way intersections, a factor that is deemed to increase the walkability, has a negative effect on low-walk individuals because of the safety concern. A similar result was found in neighborhoods in Eindhoven, the Netherlands, that leisure-time walking is associated with attitudinal factor but not the built environment (Beenackers et al., 2014). This suggests that solely creating a walkable urban setting is not the panacea for auto-oriented cities with a high proportion of low-walk population.

What about cycling?

The above study is two of many studies that suggest the importance of attitudinal factors as a determinant of walking. Fewer studies were made to separate the impact of built environment on cycling. Among those, Dill et al.’s study shows that built environment only has indirect impact biking behavior through its small influence on people’s perceptions and attitudes. These psychological factors are much more important than the built environment in explaining the low frequency of cycling of particular demographic groups, such as older adults and women.

Dill and her group also found that striped bike lanes may not have much impact on cycling. In fact, of the two studied neighborhoods in Portland, OR, residents in the neighborhood with higher density of bike lanes are less likely to bike than those who live the neighborhood with a lower density of bike lanes. Perception explains the difference in this case, as hilly terrain and traffic volume might affect people’s perceptions of the physical environment and therefore affect their willingness to bike.

Where should we start the change?

As these evidences undermine the direct impact of built environment on active transportation, they suggest that solely investing in pedestrian and bicycle infrastructures is not enough to encourage people to walk and bike more. In fact, perception and personal attitude play an important role in the personal choice to walk or bike. Therefore, an intervention from the attitudinal aspect, along with providing walking and cycling supportive environment, could be a better solution to encourage more people involving in active transportation.

Understanding the psychological aspect of mode choice is essential in order to make the attitudinal change. Travel behavior can be explained by applying Ajzen’s theory of planned behavior (Dill et al., 2014, Ajzen, 1991), which defines the likelihood of walking or cycling as an integration of personal attitude (whether or not the person likes to walk or bike), social norm (concern about other people’s opinion about cycling and walking), and perceived behavioral control (PBC) (concern about skill or ability to walk or bike, such as cycling skill, perception of barriers, and so on). As attitude and PBC are the most important factors that affect a person’s decision to walk or bike (Dill et al., 2014, Gardner & Abraham, 2008), providing a different and comfortable environment for cyclists and pedestrians would be helpful in enhancing people’s perceptions and thus increase residents’ willingness to walk or bike.

TPBTheory of Planned Behavior as a model to make sense of the travel behavior.
(Source: Dill et al., 2014)

Problems addressed in Joh et al.’s study can be solved by changing people’s attitude and social norm. Habit and experience of living or growing up in a walkable and bikeable setting play an important role in forming a positive attitude towards walking and cycling, while unpleasant experiences might create misconception and negative attitudes. At the same time, culture and influence from family members and friends (social norms) do have some (but small) impact. Therefore, planners and policy makers can make interventions by promoting and educating the public, including motorists, on walking and cycling and correct the misconception to get people with negative attitude to walk (e.g. giving free bikes to students to help them experience with cycling and changing attitude over time).

In summary, the impact of the built environment on walking and cycling might not as much as it seems, while the impact of the attitudinal factors are clearly significant. Therefore, the latter factors deserve more attention from the planners and policy makers. This is especially true in American cities where car is the dominated travel mode and the residents are unaccustomed to non-motorized transportation. The policy implication is that, with budget constraints, we should not only invest in physical environment improvement, but also invest in promotion of walking and cycling through education, public events, and marketing to change the resident’s mindset about active transportation. Helpful programs include bike and walk days (or week), bike-to-work events, teaching children to bike, safe route to school, competition between neighborhoods, and education and mentoring programs. These are low cost treatments but have higher effect compared to investing in fancy infrastructures such as decorated bike racks. Also, these programs can be done along with improving infrastructures that enhance users’ safety perception (PBC), such as cycle tracks and bike boulevards, as well as help them overcome barriers (e.g. hills). Such practices were very successful in many cities, including Portland, Champaign-Urbana, Washington, D.C., Boston, London, among other cities.

One should keep in mind that, as we are building a whole new culture of walking and cycling, we should be patient to wait for a gradual change, maybe in the next generation who is getting familiar with the walkable and bikeable environment that we build today.

REFERENCES

[1] Ajzen, I. (1991). The theory of planned behavior. Organizational Behavior and Human Decision Processes, 50(2), 179–211.

[2] Beenackers, M., Kamphuis, C. B., Prins, R., Mackenbach, J., Burdorf, A., & Van Lenthe, F. (2014). Urban Form and Psychosocial Factors: Do They Interact for Leisure-Time Walking?. [Miscellaneous Article]. Medicine & Science in Sports & Exercise February 2014, 46(2), 293–301.

[3] Dill, J., Mohr, C., & Ma, L. (2014). How Can Psychological Theory Help Cities Increase Walking and Bicycling? Journal of the American Planning Association, 80(1), 36–51.

[4] Frank, L. D., Saelens, B. E., Powell, K. E., & Chapman, J. E. (2007). Stepping towards causation: Do built environments or neighborhood and travel preferences explain physical activity, driving, and obesity? Social Science & Medicine, 65(9), 1898–1914.

[5] Gardner, B., & Abraham, C. (2008). Psychological correlates of car use: A meta-analysis. Transportation Research Part F: Traffi c Psychology and Behaviour, 11(4), 300–311.

[6] Handy, S., Cao, X., & Mokhtarian, P. (2006). Self-selection in the relationship between the built environment and walking: Empirical evidence from Northern California. Journal of the American Planning Association, 72(1), 55–74.

[7] Joh, K., Nguyen, M. T., & Boarnet, M. G. (2012). Can Built and Social Environmental Factors Encourage Walking among Individuals with Negative Walking Attitudes? Journal of Planning Education and Research, 32(2), 219–236.

[8] Lund, H. (2003). Testing the Claims of New Urbanism. Journal of the American Planning Association, 69(4), 414.


Bike share: National trends, local potential?

Global bike share expansion

From 2006-2012, the global number of public bicycles increased more than 2500 percent.[1] Shaheen and Guzman attribute the rapid expansion of bike sharing programs to the incorporation of various smart technologies, which capture more ridership data than ever and deter thefts by eliminating anonymous rentals. A global ticker at http://bikes.oobrien.com/global.php estimates total volumes of docked and in-use bikes in 105 cities, and is illustrative of the power of data and the massive momentum behind public bike sharing.

Phoenix is the latest American city to launch a bike share, rolling out its shiny new Grid Bikes this week. The program aims to reduce VMT and overall emissions by siphoning from the city’s vehicle mode share. (Fourth-generation programs such as Grid take their green objectives one step further by including solar-powered locks and docking stations.[2]) Yet a growing body of literature suggests that public bicycle use is largely a substitute for other alternative transportation modes. When a survey of 5,464 users of Capital bike share in Washington, D.C., asked respondents what mode they would have used if the bikes were not available, only 7 percent revealed they were swapping four wheels for two.[1] It is telling that ridership increases for New York’s Citi Bike when train delays increase. [3] Reducing emissions is a noble aim, but better selling points are improved health benefits and the development of a flexible, multimodal network that can attract development and contribute to a sense of place.

Phoenix, which is rolling out its shiny new Grid Bikes this week, is the latest American city to open a bike share program.

Phoenix, which is rolling out its shiny new Grid Bikes this week, is the latest American city to open a bike share program.

U.S. markets

When New York’s Citi Bike program launched in 2013, it was to skepticism and derision, then fanfare. A year and a half later, the program is hobbled like a two-wheeler with a pinch flat. The Wall Street Journal reported that the system was more than $10 million in the hole, and attributed its disfunction to the program’s failure to understand its own limitations.[3]

Most bike share programs operate like any other public transportation system. They do not expect to pay for themselves through rider fees alone, and therefore require some form of subsidy. Citi Bike, however, billed itself as a for-profit enterprise from the beginning. Because it pledged to generate revenue, Citi Bike may have underestimated the volume of casual (or tourist) ridership needed to subsidize the system.

Bike share fees have a tiered structure. Annual members, who take shorter rides, usually for non-recreational purposes, pay less per use than one-time riders, who take longer rides. Some systems, such as Capital, do not impose a fee for the first 30 minutes of use. Savvy, veteran users who exploit this loophole are quite literally getting a free ride. Yet Capital’s large proportion of casual memberships nearly paid for the system in FY 2013, when 74 percent of operating costs were recovered through user fees.[3] That number looks rosy compared to the recovery ratio for the District’s Metrobus, which was just 27 percent.

Compared to Capital, Citi Bike had 8 percent more annual memberships in 2013. Its proportion of casual trips was 8 percent lower. Citi Bike’s ridership rate is high but imbalanced. By these metrics, the program is a victim of its own success.

A bike share in Iowa City?

Every so often, one Iowa City group or another advocates for a bike share startup. We love our city, we love to bike, we see what other cities have accomplished, and we connect the dots. Here’s a blog from 2009 suggesting that 3,000 public bikes – 3,000! – be placed downtown: http://grist.org/article/2009-iowa-city-needs-bike-sharing/

Each of the last two years, the University of Iowa’s Office of Sustainability applied to the Iowa Clean Air Attainment Program (ICAAP), seeking partial funding for a bike share pilot project. The University planned to kick in its own funding to make up the difference. However, the proposal has gained no traction, but was twice denied by ICAAP.

The University proposed three bike docks, all east of the Iowa River, and each with 8-10 bikes. By clustering the system initially, the University planned to build momentum for future expansion. It is debatable whether 25-30 bikes would be a large enough supply to accomplish that aim. On the other hand, investing in only 25-30 bikes represented a small risk for the pilot project. What does seem certain is that a program of 25-30 bikes would have scarcely reduced total vehicle emissions, if at all. Although ICAAP did indicate that the University was a close contender for its dollars, it was not remiss to decline the grant application.

Could the University or the City of Iowa City support a larger bike share program?

A high density of potential users is the common denominator for all successful programs. As a medium-sized, college-dependent city, Iowa City loses a large fraction of its population during the best months of the year for generating revenue (As casual riders subsidize daily users, so too do summer months buoy the program during other seasons.[1]) Numerous northern cities – Minneapolis, Chicago, Toronto, New York – have bike share programs, but all have much larger markets. Furthermore, these cities have the adequate bicycle infrastructure and connectivity to transit that a bike share system needs to thrive. They are major tourist destinations, so pricing a system around casual ridership makes sense. And when casual, less-experienced riders go for a spin, they feel comfortable touring the city in designated bike lanes. This proximity to infrastructure is important, as a group of Virginia Tech researchers has shown.[4] Using ordinary least squares regression analysis, they demonstrated a positive correlation between Capital ridership, measured in mean rides per day per station, and infrastructure, measured in total bike lane length within a half-mile buffer of bike stations.

While Iowa City does have a few highly utilized bike lanes, such as the one-way pairs on Market and Jefferson and the separated lanes on Melrose Avenue, these lanes do not connect to an extended network. Neither has the City reached the critical mass that is needed to sustain a bike share long-term. Before either considers putting the cart before the horse, the University of Iowa and the City should work together to develop a proper foundation for success.

[1] Fishman, E. (2013)  Bike Share: A synthesis of the literature. Transport Reviews

[2] Gridbikes.com

[3] Badger, E. Why DC’s bikshare is flourishing while New York’s is financially struggling. Accessed from http://www.washingtonpost.com/blogs/wonkblog/wp/2014/04/01/why-dcs-bikeshare-is-flourishing-while-new-yorks-is-financially-struggling/

[4] Buck, D., & Buehler, R. (2011). Bike lanes and other determinants of Capital bikeshare trips. Accessed from https://bikepedantic.wordpress.com/papers-and-presentations/bike-lanes-and-other-determinants-of-capital-bikeshare-trips/

Other resources:

Virginia Tech Capital Bikeshare Study: A closer look at casual users and operations

Fishman, E. (2014) Barriers to bikesharing: an analysis from Melbourne and Brisbane. Journal of Transport Geography.

*Andy Lynch provided information about the University’s application for ICAAP funding, as well as its bike share strategy.


Complete Streets On All Streets

Complete Streets On All Streets


by: Andrew Lynch

Imagine a street that runs through the historic downtown of a city. The configuration of this street is relatively young having taken shape in the 1970’s. The travel lanes are ate least 12 feet wide and parallel parking lanes are on each side. Three lanes of one-way travel speed cars through the downtown at rates higher than the posted 35 mph. Congestion isn’t an issue since many of the business left downtown for the suburban areas. At least once a year a pedestrian or bicyclist is killed or severely injured trying to navigate or cross this street. Pedestrians find the environment uninviting and only the brave and fearless bicyclists use this street.


This is a familiar streetscape in many American cities. To counteract this, cities and other governing bodies have implemented Complete Streets policies designed to consider every road user and restore balance to the roadway while improving safety.[i] Road treatments can range from adding a bike lane to a full redesign where travel lanes are narrowed, bike lanes added, speeds lowered and sidewalks improved.


This policy, nor any policy, should be considered a one-size fits all fix for the woes of the city streets. Treatments can be done sporadically and the resulting network may have gaps. Complete Streets policies are best suited for projects on commercial corridors and arterials.[ii] With very little direct effect on residential streets, this policy misses a large portion of city streets. Even a provision that might ensure sidewalks are in place can depend on the quality of policy adopted. Cities need to look for other options to fill in the gaps.


It should be noted that while scores from the Complete Streets Coalition can rank policies there is no public distinction similar to Bike Friendly or Walk Friendly bronze, silver, gold, or platinum. Not having such a ranking leaves little incentive to improve the policy and close loopholes that would impede Complete Streets adoption.


It is possible to have another policy or infrastructure choice that would achieve many of the Complete Streets goals in residential areas. Bike Boulevards have the ability to further calm car traffic, prioritize bikes and pedestrians, create a city-wide network, and act as feeders for bike lanes on arterial streets. They have been used prominently in Portland, OR but are seeing extended use in other cities across the nation. Streets, mostly residential but this is not exclusive, are identified as low-traffic and provide connections between destinations or other bike infrastructure. The traffic is further calmed by installation of speed humps, traffic circles, roundabouts, and diverters. Stop signs are turned to require crossing traffic to stop but allow the free-flow movement on the street. Signage is used to denote the Boulevard and provide directional information while sharrows mark the road. All of these measures create a low-stress, low car traffic environment where children or adults will feel comfortable biking.[iii]


Does this treatment really work? Research suggests bicyclists will go out of their way to use off street paths and bike boulevards due to their low traffic volume nature.[iv] Paths and boulevards represent the opposite ends of the cost spectrum with boulevards on the low-cost side. Between 2009-14, Portland has built approximately 45 miles of Bike Boulevards. It is now possible to bike from the far north to the southeast on low traffic, low stress streets.


A city must be careful not to aim too low. Louisville recently unveiled their plans for a Bike Boulevard network that merely designates routes.[v] Infrastructure updates on routes will be determined by use. Granted, if there are no traffic calming features, why would people ride on them? Since these will offer minimal advantages to regular residential streets they are unlikely to attract their full potential of users.


Cities need to take a multi-angle approach to creating safe environments for all users. The diversity in road types and land uses creates combinations that cannot possibly be encompassed by just one document or policy. By realizing the limitations even a good Complete Streets policy has and incorporating the use of Bike Boulevards a city can use one network to feed another, create safe and calm routes across multiple road types and quickly introduce new infrastructure.


[i] National Complete Streets Coalition. http://www.smartgrowthamerica.org/complete-streets

[ii] Schlossberg, Marc., Rowell, John., Amos, Dave., Sanford, Kelly. (2013) Rethinking Streets: An Evidence Based Guide to 25 Complete Streets Transformations. http://www.rethinkingstreets.com

[iii] NACTO Bike Boulevards. http://nacto.org/cities-for-cycling/design-guide/bicycle-boulevards/

[iv] Broach, Joseph. Dill, Jennifer. Gliebe, John. (2012). Where do cyclists ride? A route choice model developed with revealed preference GPS data. Transportation Research Part A. Volume 46, Issue 10.

[v] Schmitt, Angie. 2014. Louisville Plans 100 miles of Bike Boulevards. StreetsblogUSA. http://streetsblog.net/2014/11/11/louisville-plans-100-miles-of-bike-boulevards/


Pedestrian safety improvements for Iowa City

Pedestrian safety is an issue of growing concern as more Americans are choosing to walk for travel as well as recreation.  In Iowa City, nearly 18% of commuters walk to work [1].  This statistic does not take into consideration children who walk to school as well as those who walk for pleasure.  While the City has made significant strides to improve pedestrian safety, especially downtown, there are occasionally some instances where planning decisions have missed opportunities for true safety enhancement.

Pedestrian Safety: A case study from Iowa City

Park Road at Ferson Avenue, and surrounding land uses

Park Road at Ferson Avenue, and surrounding land uses (Google Earth)

In 2013, parents and teachers of Lincoln Elementary School students in Iowa City approached staff regarding the installation of a safer crosswalk on Park Road at Ferson Avenue based on concerns that children had difficulty crossing the road due to the flow of traffic [2].  While no pedestrian-related crashes were recorded at the intersection, enough interest was generated within the neighborhood for staff to consider improvements to the crosswalk.  By the end of 2013, the Iowa City Community School District and city staff installed flashing pedestrian warning signs at the intersection as part of a pilot study to determine if this method improved safety at the intersection.

Pedestrian-actuated flashing crosswalk signs

Pedestrian-actuated flashing crosswalk signs at Park/Ferson (Photo by author)

The study involved three observations: one before installation, one three months after installation, and a final one nine months after installation.  The first observation provided a baseline motorist yield rate.  This confirmed the community’s concern, as motorists would only yield to pedestrians in the crosswalk 40% of the time.  Three months after installation in the spring of 2014, observations suggested that the treatment was very effective.  Staff observed that 75% of motorists were complying with the new crosswalk by yielding when pedestrians approached the intersection.  However, by the fall of 2014, compliance had fallen below the original levels to only 39%.  In fact, some drivers did not even stop while the pedestrian was in the crosswalk, although it is state law to do so.

Staff suspects that the original positive results were a product of the newness of the installation, and that once the crosswalk became a part of the visual landscape, the effect diminished.  Since the City and School District spent nearly $7000 on the treatment, other requests for this same treatment have been denied due to insufficient evidence of their effectiveness.  Alternative solutions are evaluated on a context-basis.

Reclaiming Missed Opportunities

While it’s important to use rational evaluation strategies to determine the effectiveness of different treatments, it seems absurd that policymakers continue to prioritize improvements for motorists over improvements for pedestrians.  Vehicle safety improvements, policy regarding motorists’ behavior, and enforcement have been effective at reducing rates of driver and passenger deaths in vehicle crashes.  These mortality rates have declined more than 30% between 2003 and 2012 [3].  The pedestrian fatality rate in motor vehicle collisions, however, has increased. This indicates that planners and policy makers are well-suited to improve transportation safety for residents, but some modes have seen more attention than others.

Pedestrian mortality rates, 2003-2012

Pedestrian mortality rates, 2003-2012 [3]

The example in Iowa City is indicative of this policy deficiency.  In an area near a school where staff observed a clear lack of driver compliance with regulatory signs, no further action was taken to control motorists’ behavior after only one method was proven ineffective.  To be clear, just because there have been no injuries or fatalities at the intersection does not mean that the intersection is operating efficiently for pedestrians.  In these locations where a number of neighborhood activity centers are embedded within a residential area, planners and city officials should make safety a priority, rather than a passing concern, especially in cities like Iowa City which pride themselves on walkability and encouragement for alternative transportation.

When motorists’ attitudes and behavior are valued more highly than pedestrian behavior, opportunities to make areas more pedestrian-friendly – and thus encourage more pedestrian activity – are missed.  Individuals who may want to walk, but do not want to wait for an excessive amount of time to cross an intersection, may choose another travel mode.  In this instance, students who can walk to school in their neighborhood may be driven by parents instead, contributing to greater traffic congestion.  While staff observed that these alternatives are not desirable, there have been no further steps to improve the pedestrian-friendliness at this intersection.  Simple, cost-effective enforcement strategies may have been the key missing variable, but at this point the option will not be pursued.

A wide body of literature exists on the impacts of compliance rates (for motorists and pedestrians) and safety – both real and perceived.  Equally prevalent in the literature are several studies on the effectiveness of a variety of treatments in relation to different land uses and demographics.  These studies are often archived by state and federal departments and are widely available to practitioners.  The critical barrier is an unwillingness to shift from a business-as-usual model of municipal transportation planning.

-kd

Disclaimer: I assisted with much of the analysis above, including suggesting to officials that the type of treatment described should be discontinued.  When I state here that planners should be more proactive in enhancing pedestrian safety, I intentionally apply that challenge to myself.

References cited:

[1] American Community Survey 2008-2011 3-Year Estimates

[2] Unpublished analysis completed by the Metropolitan Planning Organization of Johnson County for the City of Iowa City, October 2013-September 2014.

[3] http://www.smartgrowthamerica.org/research/dangerous-by-design/dbd2014/national-overview/

Additional resources:

Boyce, C. (2010). Walkability, Social Inclusion, and Social Isolation and Street Redesign. Built Environment, 36(4), 461-473.

Chen, L. et al. (2012). The Relative Effectiveness of Pedestrian Safety Countermeasures at Urban Intersections – Lessons from a New York City Experience. Original submittal to the Transportation Research Board 2012 Annual Meeting.

Dumbaugh, E. & Li, W. (2011). Designing for the Safety of Pedestrians, Cyclists, and Motorists in Urban Environments. Journal of the American Planning Association, 77(1), 69-88.

Dumbaugh, E. & Rae, R. (2009). Safe Urban Form: Revisiting the Relationship Between Community Design and Traffic Safety. Journal of the American Planning Association, 75(3), 309-329.

Saelens, B., & Handy, S. (2008). Built Environment Correlates of Walking: A Review. Medical Science Sports Exercise, 40(S7), S550-S566.

School Location and Active Transportation

School site locations seem to increasingly be located in sprawling, hazardous, unplanned locations that are less about a municipalities good planning and more a school boards bad decision making. Traditional school locations were typically in the middle of neighborhoods and schools were usually small. These schools would cultivate their student population from the neighboring residential developments. Thus, many of the students would typically have the opportunity to walk or ride their bicycles to school. Eventually aging schools and school consolidation have resulted in new schools being built. Unfortunately, the new school construction has typically been in greenfield locations away from neighborhoods which has resulted in negative consequences in terms of children’s ability actively get to school and increasing congestion in the areas surrounding the school (not to mention the increased environmental impact….but who really ever counts that?).

Coral Reef Senior High School in Miami

Figure 1.1 An example of a Mega school, Coral Reef Senior High School in Miami. Source: crhs.dadeschools.net

Why do local school boards recommend such drastic changes in school location? Many school boards rely on standards that recommend very large lots. In an article titled Why Johnny Can’t Walk to School by Beaumont and Pianca, they state that many state policies “require at least ten acres of land-plus one acre for every 100 students-for a new elementary schools.” That’s only for elementary schools, middle schools and high school standards for site locations typically recommend even larger sites such as the one depicted in Figure 1.1. Beaumont and Pianca point out other public policies that have directed schools locating on greenfield sites on the periphery of cities which include:

Funding formulas that favor new school construction

Local school districts receiving exemptions from local zoning laws

Building codes that which emphasize new construction methods.

These recommendations and standards leave options for site location very limited. Finding a ten acre lot for an elementary school within an already existing neighborhood is typically very hard to do. Regrettably this means that many school districts are taking advantage of site locations away from existing neighborhoods and high concentration of residential units and towards large Greenfield sites on the outskirts of town. Also even if there was a huge push for revitalizing existing neighborhood schools there’s many obstacles such as building code laws that usually sway school boards to take the road of new construction. In many cases, revitalizing may even be cheaper than building new but reimbursement policies prevent revitalizing of being a feasible option.  Beaumont and Pianca write “One problem is the so-called “two-thirds rule.” This says: if the cost of renovating an older school exceeds two-thirds of the cost of a new school, the school district should build a new school if the district wants to receive financial assistance from the state.” They continue by stating “such arbitrary percentages rules is that they prevent a full cost analysis by state and local governments and arbitrarily eliminate sound renovation projects.” Some things that may not be considered is road work, land acquisition, or public utility extensions.

A school board’s decision to locate a new school on a site that is away from any residential concentrations and on a large lot sprawling location is also in the face of national programs that promote healthier and safer ways of getting to school. Specifically, the National Highway Administrations Safe Routes to School program which was created to promote safe and active transportation alternatives to getting to school. Placing schools in areas to far or inaccessible in active ways directly undermines initiatives such as Safe Routes to School.

NL-East-Growth-Area-Info-Sheet-May2014-1

Figure 1.2 Location of the new North Liberty High School. Source: North Liberty Planning Department.

A local decision similar to the situation described above is that of Iowa City’s School Board decision to locate a new high school on a greenfield site (currently farm land) outside of North Liberty (presented in Figure 2). The problem is not necessarily that it’s in a sprawling location (because the school will primarily serve North Liberty and its growing population) but that it seems there has been a complete lack of concern about how students and parents will reach the site. It’s in the middle of nowhere. Hardly any residential development around it. Several studies have concluded that distance is a strong factor associated with the likelihood of students walking and biking to school. The further the distance, the less likely the students will use an active mode to get to school.  There does seem to be some anticipation that residential will locate near but it will hardly be enough to populate the school. Therefore instead of providing a site location that would be supportive of students using active modes to getting there, the new proposed site will most likely be accessed through personal vehicles. Further, a recent study done by the Johnson County MPO has found that the induced traffic will likely result in the recommendation to put in a new traffic signal at the closest intersection. Implementation of a traffic signal and the construction of the intersection will likely cost into the millions to construct.

School board decisions should not lie outside the scope of good city planning. The decision to locate a school outside of a residential area on a large site greatly reduces the ability for students to reach the school in active ways. Instead of increasing the amount of opportunities for students to be physically active school boards have created barriers to these opportunities. Beyond providing less opportunities for students to access these sites in an active way these “new” site locations typically do not incorporate the cost of land acquisition, traffic improvements or utility extensions. These hidden cost often come at the expense of the taxpayer who’s not only subsidizing the terrible site location the school board decided on but also has to pay for gas to get Johnny to school.

-Samuel Sturtz


Referenced Materials

Beaumont, Constance Epton, and Elizabeth G. Pianca. Why Johnny can’t walk to school: Historic neighborhood schools in the age of sprawl. National Trust for Historic Preservation, 2002.

Ralston Kent. Potential ICCSD High School Site- Traffic Impact Analysis. Metropolitan Planning organization of Johnson County, May 1, 2014.

Weigand, Lynn. “A review of literature: the effectiveness of safe routes to school and other programs to promote active transportation to school.” Initiative for Bicycle and Pedestrian Innovation Center for Transportation Studies, Portland State University, Portland, OR (2008).

Ewing, Reid, William Schroeer, and William Greene. School location and student travel analysis of factors affecting mode choice. Transportation Research Record: Journal of the Transportation Research Board 1895, no. 1 (2004): 55-63.

South Bend Implementing Smart Streets

For the first 18 years of my life, I lived within a mile of downtown South Bend, Indiana. During those 18 years, I can count on my hands the number of times that I have walked or biked downtown. As recently as last summer, when I worked downtown – two miles away from where I lived – I did not bike to work once and really never considered it a viable option. While I would have preferred to have had the options to bike to work it was simply unsafe to do so. Downtown South Bend is not pedestrian-friendly. There are three major one-way North-South streets. Each of these streets has four vehicle lanes plus parking on each side. Two of these streets are a part of U.S. 31 Business/State Road 933 thoroughfare. This configuration discourages pedestrian traffic. It allows for drivers to travel faster and in larger groups, which results in a lack of awareness and of consideration for pedestrian or bicycle traffic. In fact, people remark that pedestrians “take their right of way at their own risk.” In order to make the downtown area more inviting, South Bend City officials adopted the “Complete Streets philosophy” this past summer. Not everyone living in South Bend favors these changes, but I am confident these changes will successfully create a more inviting downtown.

DTSB

Figure 1. Looking south from the intersection of Main St. and LaSalle Ave.

The overhaul of South Bend has been phased into multiple projects which ultimately aim to increase the downtown’s attractiveness. The first major project was turning three major one-way roads into two-way roads. City officials reason that this will help “calm” traffic by slowing down the speed at which vehicles are traveling. This should also create a safer environment for pedestrian and bike traffic. In addition, the City plans to add multiple roundabouts along each of the traffic corridors, with the two major roundabouts situated at the north and south ends of the downtown. These roundabouts would in essence act as welcoming devices that alert drivers to the differential driving environment between inside and outside of the downtown. The City further hopes the roundabouts will distribute traffic across all of the roads. While this concept sounds wonderful in theory, I, like many others, have doubts the roundabouts will actually distribute traffic. I suspect that for at least an initial period of time after they are installed, these roundabouts will constrict the flow of traffic throughout downtown.

In addition to changing the directions of the streets, the City would like to change the layout of the streets as well. Once the direction of the streets is changed, the City intends to add bicycle lanes throughout downtown. The proposal places the designated bicycle lanes between the sidewalk and the on-street parallel parking. This added buffer between the cyclist and the traffic will create a sense of safety currently lacking in the present configuration. One of the principles of “Complete Streets” that the City declined to implement is the elimination of angled parking. Instead, the City seeks to change the current angle parking to reverse angle parking. In reverse angle parking, a car pulls past the parking spot and then backs into the spot at an angle, which increases safety as the driver can see traffic when pulling out of the parking space onto the road. Reverse angle parking also serves as a traffic calming device. However, a known drawback of reverse angle parking is the delays created when a significant percentage of cars back up on main thoroughfares.

To assist the improvement in the flow of traffic within downtown, South Bend is also seeking to adjust the inflow of traffic from arterials into downtown. One of the streets currently under renovation is East Jefferson Boulevard. I am personally extremely familiar with this street and its issues, as East Jefferson Boulevard is the primary access from my home to downtown. The street’s current designated layout provides for one lane of traffic with parking on both sides. However, all drivers treat it as if it were a road with two lanes of traffic in each direction. As a result, to help control traffic flow, the City has begun reconstructing segments between my neighborhood and downtown with barriers and markings that expressly limit vehicle traffic to one lane, with designated parking and a separate, delineated bicycle lane. The parking on the street has also been changed to utilize turnouts. While the current plan is to use the turnouts for parking, the bus system is currently discussing on changing these into Bus Rapid Transit (BRT) stops. All of these changes along Jefferson Boulevard create a more welcoming atmosphere. Nevertheless, these changes were achieved at a considerable cost, are taking considerable time to implement, served as a tremendous short-term inconvenience to the affected businesses along the street and have disrupted traffic patterns for extended periods. Jefferson Boulevard’s conversion is only a small portion of the entire project but serves as a microcosm for the problems that the City will confront as it implements the “Complete Streets” project on a wider scale.

Smart Streets

Figure 2. Proposed street profile for East Jefferson Boulevard

During Jefferson Boulevard’s conversion, one of the things I noticed was that people commuting into the downtown began changing their travel patterns. Instead of continuing to utilize Jefferson, which had been the busiest artery into the City during peak commute times, drivers rerouted to the two streets immediately to the North. While some rerouting was anticipated during construction, the City will possibly have to adjust its implementation of the “Complete Streets” initiative if the traffic flow is not distributed more evenly among all of the roads. While this process will take a while to be completed, early evidence reflects that the downtown is becoming more attractive and inviting.

Over the past year, I have witnessed how South Bend, through its adoption of “Complete Streets” became more progressive in its city planning. Though not everyone favors the new two-way streets, “Complete Streets” will help to make downtown South Bend more pedestrian-friendly and, therefore, more of a destination location. These changes will allow people to feel safer walking in and around downtown, including when riding their bikes to work. Upon completion, the transition to “Complete Streets” will successfully help the revitalization of downtown South Bend.

References:

City of South Bend, Indiana. (2014). “Smart Streets Initiative”

http://southbendin.gov/government/content/smart-streets-initiative

Indiana Department of Transportation. (2014). “INDOT Complete Streets Guideline & Policy”

http://www.smartgrowthamerica.org/documents/cs/policy/cs-in-dotpolicy.pdf

City of Burlington, Vermont. (2014). “Reverse Angle Parking”

http://www.dpw.ci.burlington.vt.us/docs/brochure_v2.pdf

National Complete Streets Coalition. (2014). “Fundamentals”

http://www.smartgrowthamerica.org/complete-streets/complete-streets-fundamentals

Government Officials Lack Fiscal Responsibility on Transportation Projects

Why Do Government Officials Lack Fiscal Responsibility on Transportation Projects?

Governments spend millions of dollars of taxpayer money on transportation projects every year with little to no repercussions if projects exceed budgets. No reports are published that explicitly detail where taxpayer dollars go to for these projects.  Several major transportation projects illustrate just how much needs to be done in order to ensure that the taxpayers are not being taken advantage of, government officials are acting in good faith, and to guarantee fiscal responsibility in transportation and land use projects.  One such transportation project that was particularly fiscally irresponsible from start to finish was the reconstruction of the Hillside Strangler in the western suburb of Hillside, Illinois.

Figure 1: Hillside Strangler Location (Map by Author, 2014)

           Location

Named after the Chicago suburb of Hillside, the Hillside Strangler refers to a major interchange between three interstate highways (I-88, I-294, and I-290) and two major arterials (Route 38 and Route 56).  Traveling east into Chicago, these highways and the arterials merged from seven through lanes down to three.[1]  The Hillside strangler was the worst traffic snarl in the state and one of the 20 worst congestion points in the country as the first mile of I-290 regularly took a half hour to travel through.[2]

Figure 2: Hillside Strangler Design (Source: OpenStreetMap for map data, 2010)

Strangler overview2

A merge lane from Rt. 38 and I-294 merged onto I-88.  All of these merge lanes then condensed into a single merge lane to inter onto I-290, the major interstate highway that goes into downtown Chicago.  This single merge lane entered I-290 on the left side, only making matters worse.  This complicated things much more as 20% of all traffic merging onto I-290 was trying to get off at the Mannheim interchange, about a mile down the road.  The exit to which is on the right side of the highway.[3]  This caused semis and vehicles to swerve across traffic for the next mile in order to get over to the exit lane.  Combine this awful design with the fact that about 80,000 vehicles passed through the bottleneck every day, and it’s very easy to see why the Hillside Strangler had marked congestion for about 14 hours each day.

The Hillside Strangler reconstruction project overcame several barriers to completion.  During construction, several temporary drainage plans had to be put in place due to complicated utility relocations.  A landfill in a former quarry immediately adjacent to the interchange at Mannheim road required special attention as any encroachment on the site could have exposed the project to the release of methane gas.  Opposite the landfill, on the south side of I-290, a hill of recycled asphalt had to be removed.  Approximately 3,000 lineal ft. of a 72-in. diameter water supply line, in bedrock, had to be relocated in order to make room for a new collector-distributor roadway.  Despite these challenges, the project reached its completion deadline two months early.

Hillside is a Village located in western Cook County.  It has a population of approximately 8,300 people.[4]  The population is 45% White, 37% African American, 4% Asian Alone, and 11% some other race alone.[5]

Governor George Ryan, during his 1999 inaugural address, stated, “Tomorrow morning, I am going to instruct the Secretary of Transportation to start putting together a plan to put a noose around the neck of the “Hillside Strangler” bottleneck in the Chicago area.  That engineering feat has got to be corrected.  I do not expect to wait until my three-year-old grandkids are old enough to drive before it happens.  I want it done yesterday.”[6]

The reconstruction project was a part of the “Illinois Fund for Infrastructure, Roads, Schools, and Transit Program,” more commonly known as the Illinois FIRST Program.  The program was supposed to create $12 billion in new state revenue, but only created a $6.3 billion package through fee and tax increases for use in school and transportation projects across the state.  Of this $6.3 billion, $2 billon was dedicated to public transportation projects.  From this $2 billion, the Hillside Strangler project was funded.

The major contracts that were handed were a $16 million bid to Walsh Construction of Chicago, a construction company with strong political ties to Mayor Richard Daley, a $14 million bid to Ganna Construction of Itasca, and a $5 million bid to F.H. Paschen and S.N. Nielsen of Des Plaines.  This only accounts for $35 million out of the eventual $140 million project.[7][8]

Identifying where taxpayer money goes to for transportation projects should not be difficult.  Contracts for these projects should be easily accessible, and a final report that details the financials of the entire project should be released after project completion.  Illinois is facing a budget deficit over $13 billion.  The state of Illinois spent over $6 billion on public projects through the “Illinois FIRST” program, and finding exactly where and who that money went to is a nightmare.  It is fiscally irresponsible for governments not to be forced to provide comprehensive financial records of any project that involves taxpayer dollars.


References

[1] “Interstate 290 (Illinois).” Absolute Astronomy. Absolute Astronomy, n.d. Web. 20 Nov. 2014. <http://www.absoluteastronomy.com/topics/Interstate_290_(Illinois)&gt;.

[2] “Hillside Strangler Relief Is Here” Illinois Government News Network. 24 Oct. 2001. Web. 19. Nov. 2014.

[3] “Ryan Launches Work To Eliminate “Hillside Strangler”” Illinois Government News Network. 14 Mar. 2000. Web. 25 Apr. 2011. <http://wwwb.illinois.gov/PressReleases/ShowPressRelease.cfm?SubjectID=6&RecNum=445&gt;.

[4] “United States Census Bureau.” American Community Survey Main. Web. 19 Nov. 2014. <http://www.census.gov/acs/www/&gt;.

[5] “United States Census Bureau.” Census 2010. Web. 19 Nov. 2014.

[6] “Gov. George H. Ryan Inaugural Address Prairie Capital Convention Center.” Illinois Government News Network. 11 Jan. 1999. Web. 20 Nov. 2014. <http://www.illinois.gov/PressReleases/PressReleasesListShow.cfm?RecNum=181&gt;.

[7] “Ryan Launches Work To Eliminate “Hillside Strangler”” Illinois Government News Network. 14 Mar. 2000. Web. 25 Apr. 2011. <http://wwwb.illinois.gov/PressReleases/ShowPressRelease.cfm?SubjectID=6&RecNum=445&gt;.

[8] Gregory, Ted. “$34 Million In Hillside Strangler Work Bid – Chicago Tribune.” Featured Articles From The Chicago Tribune. 11 Feb. 2000. Web. 27 Apr. 2011. <http://articles.chicagotribune.com/2000-02-11/news/0002110144_1_apparent-low-bid-widening-frontage-road&gt;.

Can Active Transportation Reduce Traffic Congestion?

NYC DOT

NYC DOT

It is no secret that peak hour is the worst time of day to be on the road. Especially in urban areas where pedestrians and bicyclists are presents, safety is compromised while everyone rushes to get to their respective destinations. My daily bike commute varies from 5 to 15 minutes depending on the time of day and I, like everyone else on the road, become impatient and expect to have intersection right of ways. I contribute to and notice the bad and sometime reckless habits of roads users; drivers speed to make the green light, bicyclists weave in and out of traffic often forgoing traffic signals, and pedestrians walk out in front of turning vehicles. As congestion threatens not only the safety of road users but also the environment—more cars on the road mean more contributors to air pollution—cities must prescribe new solutions to increase traffic flow without increasing capacity. This is why active transportation is such an integral part of city development because creating a bike-friendly environment can reduce traffic congestion.

Creating a bike-friendly environment can catalyze smart street design to eliminate many of the traffic problems known to both cause and result from congestion. A new report on protected bike lanes released by the New York City Department of Transportation offers a great example of how overall safety of drivers and bicyclists can be increased without compromising a street’s general capacity. First off, the report suggests reducing the width of vehicle lanes from 12 feet to 10 to allocate space for protected bike lanes. The diagram below shows the original configuration of Columbus Avenue between 96th and 77th street with three lanes for traffic, one for parking, and one as a parking-morning rush hybrid. After reducing the lane widths, the street was still able to maintain its original configuration, but with the added benefit of a protected bike lane.

NYC DOT

NYC DOT

Not only were vehicle volumes maintained with the lane reduction, but travel times were improved as well. Prior to the new configuration, the average travel time between the peak hours of 7:00 am to 10:00 am on Columbus Avenue, as indicated in the graph below, was 4.38 minutes. Once the bike lanes were installed, the average travel time decreased to 3 minutes, roughly a 35% decrease.

NYC DOT

NYC DOT

This decrease in travel time is credited to the addition of left-turn pockets, shown below, that allow cars to merge into a slot adjacent to the protected bike lane. The left-turn pockets accomplish two goals: first, traffic does not have to slow down until the left turn is complete and second, it is easier for drivers to see bicyclists riding up beside them. With the intent of making New York City a more bike-friendly city, the bike lanes further serve to improve road safety by displacing pedestrians and bicyclists from vehicle traffic. Additionally, the bike lanes sparked new designs for features like the left-turn pockets that were not feasible with the old road configuration.

NYC DOT

NYC DOT

Of course, smart street design is an imperative solution to traffic congestion as it physically changes vehicular movement, but the sure-fire way to decrease traffic congestion is to simply reduce the amount of vehicles on the road. While the idea may be simple, the implementation is not because with such a car-dependent society, people like the convenience and control of choosing exactly where and when they want to go. Human behavior is influenced by its environment, so in order to change the way people view active transportation, they need to be given a reason to use it. Creating a bike-friendly environment invites more people to use bicycling as a viable mode of transportation and thus, reduces the amount of cars on the road.

According to the National Complete Streets Coalition, about 44% of all vehicle trips made during morning peak hours are not related to work trips, but are instead for going to school and running errands. These trips are generally short and could easily be made by walking or bicycling; however if a city lacks the necessary infrastructure to accommodate active transportation, no one will utilize it. In 2008, the Federal Highway Administration reported that when national vehicle miles traveled decreased by 3.6%, congestion dropped 30% in the nation’s most congested areas. This reduction revealed that even the smallest shift in the amount of travelers using single-occupancy vehicles can have a significant impact on traffic congestion.

Critics of lane reduction argue that allocating space for slow-moving traffic decreases road mobility and level of service; however level of service may not be the most reliable parameter as transportation is a whole lot more than moving cars quickly. Last year, California State Legislature evaluated the flaws in the Level of Service paradigm that encourage road-widening, the removal of pedestrian crosswalks, and slow transit projects. To replace the Level of Service requirement, the Legislative proposed Vehicle Miles Traveled as an alternative assessment. Instead of projects being evaluated on if they will slow down traffic, they are being evaluated on if they increase vehicle miles of travel.

Lane width reduction allocates space for bike lanes without slowing down traffic. Bike lanes spark new street designs that support active transportation, improve safety, and optimize road space for both vehicles and bicyclists. With safer streets and improved active transportation infrastructure, people will be more likely to use the streets for short trips and recreation, thus removing the amount of cars on the road, which in turn, can actually reduce congestion.

References:

Eaken, A. (2014). “How Three Little Letter Can Make Such a Big Difference: LOS, Meet VMT”

http://switchboard.nrdc.org/blogs/aeaken/how_three_little_letters_can_m.html

Federal Highway Administration. (2008). “Traffic Volume Trends”

http://www.fhwa.dot.gov/ohim/tvtw/08dectvt/index.cfm

Jaffe, E. (2014). “When Adding Bike Lanes Actually Reduces Traffic Delays”
http://www.citylab.com/cityfixer/2014/09/when-adding-bike-lanes-actually-reduces-traffic-delays/379623/

National Complete Streets Coalition. (2011). “Complete Streets Ease Traffic Woes”

Click to access cs-congestion.pdf

New York City Department of Transportation. (2014). “NYC Protected Bike Lanes”

Click to access 2014-09-03-bicycle-path-data-analysis.pdf

Speck, J. (2014). “Why 12 Foot Traffic Lanes are Disastrous for Safety and Must be Replaced Now”
http://www.citylab.com/design/2014/10/why-12-foot-traffic-lanes-are-disastrous-for-safety-and-must-be-replaced-now/381117/