When Vending Machines Have Wheels (and Motors): The Implications of Automated Vehicle Deliveries on Local Land Use and Transportation Networks

Imagine the year 2035. You wake up one morning and open your kitchen cabinet, ready to help yourself to a nice bowl of your favorite breakfast cereal. You open your refrigerator and then it dawns on you—you’re out of milk. After the gravity of this dire situation sets in and you recompose yourself, you then pull out your cell phone and order some 2%. Minutes later, an automated shuttle pulls up to your doorstep. You run out, punch in the PIN given to you when you placed the order in your smart phone app, grab the item you ordered from the shuttle’s dispenser, and polish off a tall bowl of Corn Flakes. The future sure looks bright, doesn’t it?

With the advent of automated vehicle (AV) technology, transportation experts posit a series of benefits that these vehicles can bring to communities. Improved safety by reducing the number of traffic collisions occurring on roads, mitigating environmental concerns through reduced transportation-related emissions, improved efficiency of transportation networks, and opportunities for individuals with previously little to no access to an automobile to improve their mobility are all seen as the primary opportunities offered by automated vehicles (Bagolee & Tavana, 2016). On the flip side, these vehicles could present several challenges that communities must consider when setting out to plan for this technology. Issues like negative impacts on health owing to reduced levels of activity (i.e. walking and biking), rampant congestion, exacerbated urban sprawl, and reduced transit ridership are all concerns that cities must take into account when conducting land use and transportation planning projects in the future (Henaghan, Rouse, & Coyner, 2018). Another challenge to planning for automated vehicles is the precarious nature surrounding the technology—there is a huge number of unknowns regarding the role automated vehicles will play in urban landscapes, the capability of these vehicles to navigate dense urban areas, and even the timeline for their integration into transportation networks.

The prospective opportunities and risks of AVs
Source: Gertz Gutsche Rumenapp

While there is much discussion around the role automated vehicles will play for residents, especially private AVs, and their timeline for introduction into local roadways, some industry leaders are looking towards a different scenario for the first applications of this fledgling technology. For instance, Nan Ransohoff, the Head of Product for the AV startup Nuro, believes the first uses of AVs will not be for moving people, but rather for moving groceries (Turner & Kapsis, 2019). Her company is now designing and implementing pilot programs with local supermarkets that shuttle grocery deliveries in unmanned vehicles right to resident’s front doors. But groceries are not the sole focus of Nuro’s AV activities; the vision of Nuro founder Dave Ferguson is one in which these small, driverless vehicles will take over last mile deliveries ranging from groceries to dry cleaning to e-commerce and everything in between (della Cava, 2018).

A prototype for a Nuro AV delivery shuttle
Source: Nuro ai

However, Nuro is not the only company looking to revolutionize local last mile delivery services. Ford recently announced its intent to partner with Walmart and Postmates to design a pilot program for AV grocery deliveries, while Amazon has been testing AV deliveries in compact shuttles that roam city sidewalks in the state of Washington. Some companies—Waymo, Udelv, and Ford—are also looking into testing AV shuttles that will pick up individuals, shuttle them to local supermarkets, and then take them home after purchasing their groceries (Redman, 2019). While these exciting developments could lead to a future in which you can do all your shopping from the convenience of your home, reimaging the distribution of goods via AVs could likely have profound impacts on local land use and transportation networks.

A Walmart employee loading up an AV pilot shuttle for delivery
Source: Walmart

Introducing these automated delivery services could yield benefits for community residents, especially mobility challenged households and seniors who may already be struggling to get the daily goods they need but these services will not be without their own costs (Zaleski, 2017). The use of automated vehicles for delivery purposes could very likely result in increased VMT and congestion as city streets would see these vehicles constantly roaming neighborhoods to drop off resident’s orders and then head back to their respective origin locations to reload for the next delivery. At a time when congestion is the primary challenge transportation planners in urban areas face, these delivery services could seriously undermine efforts to curb congestion.

Not only is congestion a concern for city leaders, but so is the issue of parking these vehicles. With big-box stores, like Walmart, looking to wield AV technology to expand their retail sales through home delivery, it is likely they will need a large fleet of AVs for this service to be viable. As parking has been a challenge for cities, introducing large vehicle fleets and meeting their parking needs will pose further issue for cities looking to manage land uses and curb space. However, for big-box stores they hold the key to this issue in their retail locations—the large parking lots mandated by local zoning regulations can serve as overnight parking for their AV fleets. But this does not address the issue for smaller retailers who are not located in the fringe areas of cities or have giant parking lots onsite. As AV delivery services are expanded, these retailers will want to get in the AV delivery service game as well. This means city leaders will need to figure out how to efficiently allocate space to allow for smaller retailers to compete with the AV delivery services of companies like Wal Mart and Amazon who have already been disrupting small business’s operations.

This multi-faceted problem will likely cause city officials headaches in the near future. As cities strive to revise land use regulations to minimize the impacts of automobiles, the innovative disruption of AV services could run counter to their efforts. Small retailers could quickly be run out of businesses as they fail to compete with big-box stores and online retailers while VMT and congestion could continue to increase. Trying to balance parking needs while reclaiming streets for all users could result in the over provision of parking spaces, perpetuating inefficient uses of land in urban areas. City leaders must work with residents to define the role they want automated vehicles to play in their communities while protecting small businesses and re-prioritizing roads and curb space for all users, not just cars. In an era of innovation aimed to increased convenience and time savings, we must ask ourselves—how much is convenience really worth?

References

Bagolee, S., & Tavana, M. (2016, December). Autonomous vehicles: challenges, opportunities, and future implications for transportation policies. Journal of Modern Transportation, 24(4), 284-303. Retrieved from https://link.springer.com/article/10.1007/s40534-016-0117-3#citeas

della Cava, M. (2018, January). With Nuro self-driving R1, your delivery just shows up– in a toaster on wheels with no driver. Retrieved from USA Today: https://www.usatoday.com/story/tech/2018/01/30/your-delivery-just-showed-up-toaster-wheels-no-driver/1062856001/

Henaghan, J., Rouse, D. C., & Coyner, K. (2018). Preparing Communities for Autonomous Vehicles. Chicago: American Planning Association. Retrieved from https://planning-org-uploaded-media.s3.amazonaws.com/publication/download_pdf/Autonomous-Vehicles-Symposium-Report.pdf

Redman, R. (2019, January). Amazon tests autonomous vehicles for deliveries. Retrieved from Supermarket News: https://www.supermarketnews.com/online-retail/amazon-tests-autonomous-vehicle-deliveries

Turner, M., & Kapsis, J. (2019, February ). Self-Driving City: What does our future really look like when autonomous vehicles take over the roads? CityLab. Retrieved from https://www.citylab.com/solutions/2019/02/podcast-technopolis/583096/

Zaleski, A. (2017). Cities Seek Deliverance From the E-Commerce Boom. Retrieved from CityLab: https://www.citylab.com/transportation/2017/04/cities-seek-deliverance-from-the-e-commerce-boom/523671/

What Built Environment Factors Influence Active Travel Trips? An Analysis of Different Block Groups in Iowa City

In the transportation field, the built environment is considered an important determent of peoples’ travel behaviors. Walking and bicycling plays an integral part of Iowa City’s transportation system. These modes of active transportation have numerous benefits for the community. It is argued that active modes of travel reduce pollution in urban areas, promote the health and well-being of people, and efficiently use urban road space for commuters. This article explores the associations between people’s active transit trips and characteristics of Iowa City at a block group scale. Attention is given to the correlation, not the causation, of different block group characteristics with walking trips. To understand the different block groups characteristics in Iowa City, 49 block groups were selected and analyzed based on the variables described in Table 1. To understand the active transport trips at the block group level, Smart Location Data and Walkability Index data were collected from the Environmental Protection Agency (EPA).

Table 1: List of selected variables and their description for analyzing the built environment and active transport trips in different block groups of Iowa City.

Variable Name Description
National Walkability Index Score Scores an area from 1 to 20, with higher score indicating better walkable conditions
Mix of Housing and Employment Index Higher index value indicates an area of diverse set of employment (retail, business, etc.) and occupied housing
Street Intersection Density Measured as the number of pedestrian-oriented street intersections per square mile
Average Miles Traveled for Employment Trip Average daily vehicle miles traveled generated by each employee commuting to and working at a given facility (miles per person per day)
Percentage of Active Transport Mode Percentage of people using active modes of transport in their daily trips (walking, bicycling, etc.)
Population Density Number of people living per square mile area of a block group

According to the walkability score, 11% of the Iowa City block groups are in the least walkable category, 75% of these neighborhoods are in the below average category, and the rest are in the above average category. The walkability score spatial distribution in Iowa City block groups is illustrated in Figure 1. Overall, Iowa City has poor walkability compared to other American cities. From the illustration, it is evident that most parts of Iowa City area are below average walkability. In some of parts of downtown Iowa City, there are some areas of above average walkability. Additionally, significant variation in the walkability conditions among block groups can be seen in the center of Iowa City.

(Data Source: EPA, 2012; Map Prepared by: Author)
Figure 1: Walkability Conditions in Different Block Groups of Iowa City.

The active mode trip as a percentage of total trips in different block groups is shown in Figure 2. Figure 2 reveals that despite having a lower walkability index, a significant portion of the block groups have a high percentage of active transport in modal share.

(Data Source: EPA, 2012; Map Prepared by: Author)
Figure 2: Percentage of trips made by active modes of travel in different block groups of Iowa City.

After conducting a Pearson’s correlation analysis, a negative association was found between the block groups’ housing and employment mix index and peoples’ use of active modes of travel. Also, another interesting finding is that the walk score in different blocks groups is poorly correlated with the peoples’ use of active modes of travel. A reminder of note is that the active mode of travel statistics includes both walking as well as bicycling.

There is positive association found between the street intersection density and walking (correlation value of 0.621). Although this correlation does not imply causation, it is noticeable that people using active modes of travel are in areas where the street intersection density (pedestrian-oriented intersections) is higher. This is important regarding the built environment and active transit modes in Iowa City. Although the literature shows that people tend to walk more in areas of high job-housing mix and high pedestrian-oriented intersection density, Iowa City only shows a strong correlation between intersection density and walk trips (EPA, 2012).

Another interesting finding results from examining the average daily vehicle miles traveled generated by each employee commuting to and working at a given facility (miles per person per day) of the block groups. A strong negative association is found between this variable and people’s use of active mode of travel in different block groups (correlation value of -0.548). Also, people’s daily travel miles are closely related to the amount of greenhouse gas emissions and consequently, a strong negative association was found between the use of active modes of travel and the amount of per capita emission in a block group (correlation value of -0.547). Additionally, there is a strong negative association between miles traveled and street intersection density (-0.667) which shows that people in areas of high pedestrian-oriented intersection density are commuting less. Another interesting outcome is that people in the high population density (per square mile) areas are using more active modes of travel compared to people living in the low population density areas (a positive correlation value of 0.6288).  

People in Iowa City are using active modes of travel in areas with high density and high street intersection density. However, this strong correlation does not suggest causation and influential factors for using active travel modes may vary from place to place. There is a poor correlation between the walkability index and peoples’ use of active modes of travel, implying that several other factors may contribute to peoples’ use of active transport modes in different areas. These factors should be evaluated in the further research.

Reference:

US EPA (2014, February 27). Smart Location Mapping [Data and Tools]. Retrieved March 14, 2019, from https://www.epa.gov/smartgrowth/smart-location-mapping

Sustainable Urban Mobility – The New Horizon for Cities

Urban mobility is a complex topic for many cities throughout the world, where single-occupancy vehicles stand out and the consequences of air pollution and noise hinder energy sustainability. Sustainable mobility is more than getting from one place to another; it is a factor of progress and economic development. Mobility remains an essential factor for improving the quality of life. After all, transportation is a basic need and ensures access to cultural activities which can widen horizons and expand lived experiences.

Sustainable Earth – Source: Capima (www.capima.com.br)

The increase of urban sprawl combined with problems of public transportation policies and economic growth have influenced the transportation modes of the population. People tend to use single-occupancy vehicles to overcome the issues induced by inadequate transportation policies. The negative externalities of single-occupancy vehicles increase with more vehicles on the roads, creating more traffic congestion, environmental problems, air pollution, and increases in the number of accidents. According to the Pedestrian and Bicycle Information Center, there were a 12.1 percent increase of pedestrian fatalities and 6 percent increase of bicycling fatalities between 2006 and 2015.

The integration of human and environmental health based on sustainable urban mobility can decrease the users of single-occupancy vehicles and transform the current scenario into a smart and dynamic system. The approach of sustainable transportation as a system relates to a modified Social-Ecological Model. The individual is the traveler, the environments are divided among the vehicles, transportation system, and the built environment. The strategy is based on three basic principles: better sidewalks, reliable access to transit systems, and investment in cycling infrastructure. These three principles are associated with four main benefits.

Sustainable Mobility Initiative Approach – Source: NREL Transforming ENERGY

The first principle of improved sidewalk infrastructure relates directly to the second principle of frequently utilized public transportation system. The usage of the built environment is a product of its design, which in turn influences the way people use it. Thus, streets with adequate space for pedestrians will more likely be used. On the other hand, deficient, obstructed, or discontinuous sidewalks will negatively influence pedestrian usage. The quality of sidewalks is associated with perceived comfort during walking. This can determine the willingness of people to use or not use them on their daily commutes. Moreover, a proper sidewalk system with a reliable transit system increases the usage of public transportation. According to the Federal Highway Association, cities that provide sidewalks, especially, with access to public transit, are expected to have increased transit usage since individuals would have more commuting options. However, access to transit systems is also related to the quality of the surrounding area of transit stops and stations, which influence user experience during their travel and can either stimulate or discourage their modal choice.

Sustainable mobility also depends on the third principle of adequate cycling infrastructure investments. Investments focused on bicycling infrastructure can generate positive externalities for cities. According to the Pedestrian and Bicycle Information Center, investments in bicycling and walking projects can generate up to 14 jobs for every $1 million spent, while highways projects only create about 7 jobs. Additionally, expansion of cycling infrastructure is directly correlated with increases in property values and lower crime rates by providing recreation opportunities for the community. Moreover, investments in cycling infrastructure can also be related to the economic development of the region where the project was implemented. Besides the positive externalities related to jobs and the increase of property values, bicycle and other mobility projects can stimulate local businesses, which improve the quality of life for the entire community.

Modal Interaction – Source: Capima (www.capima.com.br)

Adopting the three principles of urban mobility shifts the current unsustainable transportation system to a more integrated and sustainable approach. In this way, the strategies will raise awareness of the population for the use of alternative transportation and encourage incentives for the use of transit systems. Four benefits would result from this transition to sustainable mobility. One of the most significant environmental problems that negatively impact urban areas is the high concentration of pollutant gases in the atmosphere. Therefore, the implementation of strategies that discourage the usage of motor vehicles promotes significant improvements in the air quality of urban areas. Additionally, sustainable mobility supports non-motorized mode choice or increases transit usage, which influences the reduction of noise pollution while decreasing the usage of vehicles. The third benefit promotes better land use. Reducing dependency on cars results in decreased traffic congestion and overall efficiencies in mobility. The reductions in congestion can be associated with the optimization of the usage of the open space to replace the areas of congestion with gardens, parks, trails or even local commercial spaces that would benefit the community. Finally, decreases in motorized modes of transportation contributes to the health and welfare of communities by encouraging physical activity and active transportation.


Space required to transport 70 people – Source: (www.humantransit.org)

Although investments in sustainable mobility contribute to improvements not only for traffic but also community health and the quality of life, sustainable urban mobility still faces numerous barriers for its implementation, especially in the big cities. In order to create a reliable system, pedestrian and cyclist projects need to be prioritized in planning. One of the solutions is to promote modal integration to connect with different modes. This integrated network would allow citizens to use different modes without any difficulty and serve as an effective response to the challenges of urban mobility.

References

ENERGY, N. T. (2019, March 13). Retrieved from https://www.nrel.gov/transportation/sustainable-mobility-initiative.html

Federal Highway Administration (FHWA). (2015). Safe Roads for a Safer Future. Washington, DC: FHWA Office of Safety.

NREL Transforming ENERGY. (n.d.). Sustainable Mobility Initiative. Retrieved from NREL Transforming ENERGY: https://www.nrel.gov/transportation/sustainable-mobility-initiative.html

Pedestrian and Bicycle Information Center. (n.d.). Economic Benefits of Walking and Bicycling. U.S. Department of Transportaion.

Pedestrian and Bicycle Information Center. (n.d.). Economic Benefits of Walking and Bicycling. Washington, DC: U.S. Department of Transportation Federal Highway Administration.

Racca, D. P., & Dhanju , A. (2006). Property Value/Desirability Effects of Bike Paths Adjacent to Residential Area. Newark, DE: College of Human Services, Education, and Public Policy .

Walker, J. (2012, September 21). Retrieved from Human Transit: https://humantransit.org/2012/09/the-photo-that-explains-almost-everything.html

“Connected vehicle tech: Is Vision Zero possible?”

What’s the problem?

Road safety is an issue that has perplexed the United States and the world for decades. Valiant efforts have been observed in policy changes, new regulations, driver education programs, safety protocols like helmets and seatbelts, and increased enforcement. Yet, they have barely chipped the iceberg of saving lives. In the U.S. reported road traffic deaths of drivers have decreased since 2008 from 51% to 47% of road traffic deaths (see Figure1) (Geneva: World Health Organization 2009, 2009) (Geneva: World Health Organization 2018, 2018).

So, this is a win, right? Sure, for some, unfortunately, reported road traffic deaths of the most vulnerable road users, pedestrians, have increased since 2009 from 11% to 15% in 2018 (see Figure2) (Geneva: World Health Organization 2009, 2009) (Geneva: World Health Organization 2018, 2018) and overall trends in road traffic safety have decreased. Moreover, the USDOT’s 2016 fatal crash data found that motor vehicle crashes were the leading cause of death for children aged 10 and for every age person from 16 through 23 in 2015 (National Highway Traffic Safety Administration, 2018). Additionally, in 2016, 37,461 people in the U.S. were killed in traffic crashes (National Highway Traffic Safety Administration, 2017). To bring it home, the National Motor Vehicle Crash Causation Survey 2005-2007 (NMVCCS), an effort conducted to define the causes of crashes, found that 94% of the 5,470 crashes in this analysis were a result of human error (National Highway Traffic Safety Administration, 2015). Sadly, this is an issue in desperate need of innovation, but is it technology that will pave the way for a future of safe travels?

Figure 1 Global Status Report on Road Safety, 2009
Figure 2 Global Status Report on Road Safety, 2018

Connected Vehicles (CV) and Automated Vehicles (AV)

“Connected vehicles are believed to enable safe, interoperable networked wireless communications among vehicles, the infrastructure, and passengers’ personal communications devices” (U.S. Department of Transportation, 2019). CV systems are quite different than the technologies that the most up-to-date AVs use. AVs have a host of safety features like cameras, sensors, and radar that inform the crash avoidance software in the vehicle. The software is capable of instructing the vehicle to take over the driving task in order to prevent a dangerous encounter during a drive. CVs use communication via radio devices to warn drivers about impending danger. There are a few types of CV transmissions: vehicle-to-vehicle (V2V), vehicle-to-infrastructure (V2I) and infrastructure-to-vehicle (I2V). Messages transmitted V2V may indicate unsafe speeds, brake status ahead, possible collisions and road blocks. They also have a long distance of detection with “seeing” around corners or through other vehicles. These capabilities are able to perceive threats sooner than AV sensors, cameras and radar.

V2I allows a vehicle’s communications system to exchange information with traffic signals and is becoming quite popular in Florida. Florida Department of Transportation has begun a CV initiative using traffic signals to exchange information between vehicles, drivers, the roadside, bicyclists, and pedestrians by using Signal Phase and Timing (SPaT). Some of the regions deploying this project are Orlando, Tallahassee, Pinellas County, Ocala, The Villages (the retirement capital!), Tampa and Gainesville (Florida Department of Transportation, 2019).

Changes in land use and connected vehicles are anticipated to enhance safety of pedestrians and users of public transportation in at least three ways. The Pedestrian in Signalized Crosswalk Warning is a warning system for bus drivers to alert when a pedestrian is in a marked crosswalk or signalized intersection; Mobile Accessible Pedestrian Signal System (PED-SIG) is an application that allows for an automated call and audio cues to help pedestrians safely cross a road; and Transit Bus Stop Pedestrian Warning is an application that alerts transit bus drivers at major bus stops when passengers are in the path of the bus as it pulls in or out of a stop (U.S. Department of Transportation, 2019).  These systems have also developed in ways that can recommend the optimum travel speeds in congested roadways, speeds that account for traffic incidents, and other road conditions in order to increase the efficiency of traffic flow and encourage the reduction of crashes.

Where are we now?

These are just a few examples of what is happening in the world of connected vehicles. The advantages go on, but still many unresolved issues remain. Currently underway are pilot programs funded by the U.S. Department of Transportation in three states: Wyoming (WYDOT), New York (NYCDOT), and Florida (THEA). These pilot programs are aimed at integrating the research behind the concepts and bring them into practice. The most unresolved issues do not lie in the technology, but with the institutions and the deployments of the technology. Financial issues and initial funding is another barrier to overcome with this life-saving and time-saving innovative technology. Things to consider are mobile devices for the warnings, the infrastructure enhancements needed for communications, transportation management centers capable of transmitting vital data to the vehicles, as well as a consistent industry language among the users for future performance measurements. Vision Zero is in the scope. It is now a matter of logistics.

References

Florida Department of Transportation. (2019, March 14). The Florida Connected Vehicle Initiative. Retrieved from Traffic Engineering and Operations Office: https://www.fdot.gov/traffic/its/projects-deploy/cv

Geneva: World Health Organization 2009. (2009). Global Status on Road Safety: Time for Action. Geneva: Bloomberg Philanthropies.

Geneva: World Health Organization 2018. (2018). Global Status Report on Road Safety 2018. Geneva: Bloomberg Philanthropies.

National Highway Traffic Safety Administration. (2015). Critical Reasons for Crashes Investigated in the National Motor Vehicle Crash Causation Survey. Washington, DC: U.S. Department of Transportation.

National Highway Traffic Safety Administration. (2017). Traffic Safety Facts. Washington DC: U.S. Department of Transportation.

National Highway Traffic Safety Administration. (2018). Quick Facts 2016. Washington, DC: U.S. Department of Transportation.

U.S. Department of Transportation. (2019, March 14). Office of the Assistant Secretary for Research and Technology. Retrieved from Intelligent Transportation Systems – Connected Vehicle Basics: https://www.its.dot.gov/cv_basics/cv_basics_20qs.htm

Headline photo: “MWC: Sound waves to connect devices.” https://gadget.co.za/mwcsoundwaves/ March 14, 2019.

The Rise of “Hyperloops” A Pipe Dream

By Michael Delp

Image result for boring company hyperloop
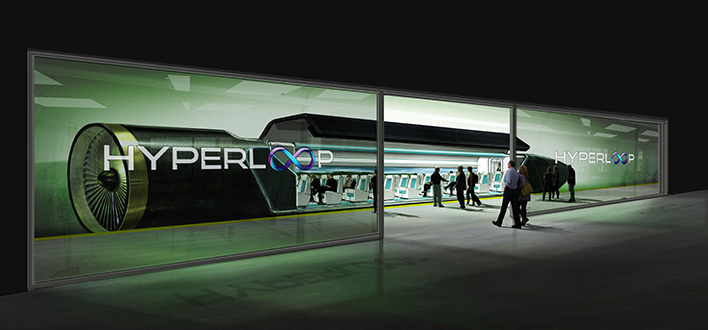
HyperLoop Source: Virgin HyperLook

Many might think the idea of Hyperloop transportation came to be in 2013 with Elon Musk’s first written proposal on loop technologies , and the inception of his “Boring Company”, but the concept is much older. The idea of a vacuum powered transportation predates any Elon Musk Twitter rants fueled by copious amounts of substances, possibly marijuana. The history of harnessing vacumm power to move object stretches from the Greek age through the Industrial Revolution to Modern Day. Musk might be falling off the wagon a bit with his company management and endeavors, but he has ignited a world of speculation and development into Hyperloops.

Image result for Elon musk smoking weed
Elon Musk on the “The Joe Rogan Experience Source: CNBC

How They Work

Hyperloops have the ability to transcend the constraints of friction that affect every mode of transportation. This is done by removing all of the air or most of the air from these tubes ( think of a mail tube that you’ve seen in movies) (GB). Modes of transportation are made to be more aerodynamic to ease or erase some of this air friction. Cars and trucks are made with more curves to avoid and ease this interaction with the air. In Musk’s design the transportation tube is suspended above the bottom of the tube by a thin layer of remaining air and hurdled forward using vacuum forces (GB).

History of Pneumatic Tube Transportation

Pneumatic tubes and means of transporting products has been prevalent throughout history. The word Pneumatic comes from the Greek word “pneuma” which translates to invisible or weightless air (LR). Vacuum technology was taken advantage of in ancient times through the use of suction and vacuum on toilets and plunging technologies (IO9). These applications can compare very minimally to the advances made in the Industrial Revolution. Some of the early examples of mechanical tube transportation in the Industrial Revolution can be traced back to the London Stock Exchange system, which was built in 1853 (IO9). This was for the transportation of documents important to the market, and was later implemented in various American Cities such as Philadelphia (LR).

crosssection
London Vacuum Tubes Source: GB

The first application of pneumatic tubes to move carriages carrying people was coined “Beach Pneumatic Transit”(NYCS). Inventor Alfred Ely Beach constructed his demonstration line in 1870 which included a one track line that would travel 300 feet (NYCS). This construction of the Beach Line took place in New York City between Warren and Broadway street close to city hall (NYCS). The Beach Tube never amounted to more than a curiosity and a attraction to be shown off with no large scale practicality.

Beach Tunnel Source: NYSC
beach-map.jpg
Beach Tunnel Source: NYSC

Current Hyperloop Development

Richard Branson seems to be playing follow the leader with Elon Musk after a major investment in HyperLoop One, which is now named Virgin HyperLoop One (GB). They plan to use vacuum technology couple with magnets to speed a transportation pod fast enough to where it is lifted off the ground reaching speeds close to 670 MPH (GB). Sites for development are being looked at in the US, Europe, and Middle East (GB).

HyperLoop Transportation Technologies is another company conducting feasibility studies on possible routes in Asia and Eastern Europe (GB). Their system also uses magnets in conjunction with vacuum process and has been compared to a Maglev train (GB). They are boasting possible speeds of 700 MPH and would be the fastest Hyperloop transportation system proposed yet (GB).

The Boring Company has built their test tunnel that currently resides in Hawthorne, California (BC). The current length of the test tunnel stretches 1.14 miles from Crenshaw Boulevard to Prairie Ave and 120th St (BC). The primary goal of this project was to look at small footprint builds for hyperloops. They have plans for other projects in LA, Chicago, and the Northeast Corridor (BC).

Image result for boring company hyperloop
Boring Machine Source: Boring Company

Future Viability

Multiple companies have put substantial investment into developing these high speed systems of transportation. They seem to be more realistic and viable for higher density countries in Europe or in South Korea. America has failed miserably to develop any type of high speed rail with enormous government and private investment. Some of the failures reside in the cost of land and lack of high density populations. The high cost of land could be sidestepped by building these hyperloops underground as the strategy that The Boring Company has implemented in California. This would allow for cheaper purchases of land and would avoid any major bypass problems.

References

Jennifer Ouellette “A brief history of the pneumatic tube transport systems that never were”https://io9.gizmodo.com/a-brief-history-of-the-pneumatic-tube-transport-systems-5822028 (IO9)

“Projects”https://www.boringcompany.com/projects (BC)

New York Subway “Beach Pneumatic Transit”https://www.nycsubway.org/wiki/Beach_Pneumatic_Transit (NYCS)

“What is hyperloop, how does it work and when will it arrive?”https://www.gearbrain.com/what-is-elon-musk-hyperloop-2505477906.html (GB)

Road Diets: A Problem for Emergency Services, or a Way to Improve Traffic Safety?

In the mid-90s, Ft. Madison, Iowa decided that they needed to adapt their town for a predicted increase in traffic. More specifically, they made the decision to change Highway US-61 from a 2-lane road to a 4-lane road. This decision was made under the assumption that wider roads meant better traffic flows. However, as many transportation planners know, larger roads don’t always result in safer, less congested roads. The “fat road” that was implemented in Ft. Madison actually led to a significant decrease in road safety and a huge loss in value for the city as shown in the chart below (Welch, 1999). This type of widening is generally more expensive, allows for more cars onto the road (therefore increasing car dependency), and makes it harder for pedestrians to cross the street. The results of this study beg the question, if making roads larger leads to less traffic safety, does making them smaller lead to more traffic safety?  To start, let’s look at what implementing a road diet actually means.


Source: Welch (1999), TRB Circular E-C019 (CITYLAB)

WHAT IS A ROAD DIET?

According to a paper published by the Pedestrian and Bicycle Information Center, road diets are the “reallocation of road space through reduction of the number of motorized traffic lanes” (Thomas,2013). Simply by changing a four-lane road with two lanes going in each direction to a three-lane road with two lanes going in opposite directions and a turning lane in the middle, the number of points where accidents can occur are greatly reduced. Although road diets have been around since the 1970s, more and more communities across the country have been implementing road diets in recent years. This has been done for rural thoroughfares in states like Iowa and Nebraska, as well as major corridors in larger urban areas in states like Oregon and California. The ideal roadway for a road diet is a road that carries 12-18,000 auto trips a day. However, some cities (Santa Monica, California) have seen success at numbers between 20-25,000 auto trips a day. (Burden and Lagerwey, 1999)


Source: Highway Safety Information System

How Does a Road Diet Improve Traffic Safety

One of the main issues with 4 lane roads is that there will always be spare lanes in a driver’s direction. This causes drivers to go faster than they should, under the pretense that open space means they can increase speed. During rush hour traffic, when cars are constantly changing lanes and moving on and off the 4-lane road, these increased speeds can than translate into higher accident counts.  Studies have shown that urban roads that have received road diet treatments have seen crash reductions by 19 percent. The crash reduction stats are even higher for rural roads at 47 percent (Thomas, 2013). However, road diets do not only improve safety for those using motorized travel, they also greatly improve safety and convenience for pedestrians and bicyclists. This is because as opposed to taking away the pavement of 4 lane roads when they are converted, in many cases the extra space is reallocated into on street parking or bike lines. How bike lanes can help facilitate nonmotorized transportation is self-explanatory. However, the on-street parking allows for a barrier between the sidewalk (or bike lane if the city chooses to go the protected bike lane route) so that pedestrians will have a wall of steel between the sidewalk and the cars moving on the road.

Protected Bike lanes in Northridge, California Source: LA.Streetsblog.org

Potential Problems with Road Diets

One of the main things that prevents cities from implementing road diets is the car dependency of the public. More specifically, the notion that decreasing the number of lanes on a road will then lead to an increase in travel time. In most cases although the commute time on dieted roads does not decrease, it also does not increase significantly enough to cause alarm. For example, a study done by the Pennsylvania DOT showed that accidents on a dieted road dropped significantly, while at the same time leaving trip time unaffected (Burden and Lagerwey, 1999). Even with statistics that point to road diets creating safer roads, some citizen groups say that it causes problems for emergency response teams. For example, a Bill has been introduced to congress in Iowa that aims to make it harder for the Iowa DOT to implement road diets without a more democratic process. Drawing from an issue where Paradise, California had a problem where residents had trouble evacuating their homes from a wildfire, some opponents say a wider road would have saved more lives (Albertson, 2019). Citizens of Waverly, Iowa have created a Facebook page that opposes the land reduction on Highway 3 that runs through the center of town. This group states that the road diet has majorly increased the congestion on the road and is therefore could make it harder for emergency services to reach their destinations. Although local health officials say that they haven’t experienced any problems, the opposition still remains.


A Post about a town hall meeting on the Keep Waverly Moving Facebook page

Source: Keep Waverly Moving Facebook Page https://www.facebook.com/KeepWaverlyMoving/?ref=br_rs

Final Verdict

Road diets from a planning perspective could be seen as something the transportation safety field has seen great success in. The accident reduction numbers are very positive across the board, regardless of the size of the community or the built environment that a road diet is implemented in. However, there are somethings that the public has concerns about and road diets should be implemented in a democratic way so as to make sure everyone can voice their opinions. Moving forward, city/transportation planners should consider potential road diet sites on a case by case basis. City officials should look to the future to make sure that the road being considered for a diet will not exceed the 20,000-25,000 vehicles per day that could make the diet a congestion problem. As long as these guidelines are followed, a road diet can both increase on road safety, as well as provide more protection for pedestrians and bicyclists. Doing all of this, while at the same time providing an incentive for people to use nonmotorized transportation.

References:

Albertson, Teresa. “Is DOT Pushing Iowa Towns to Adopt ‘Road Diets’? House Bill Would Limit State Agency.” Des Moines Register, 29 Jan. 2019.

Burden , Dan, and Peter Lager. “Road Diets Fixing the Big Roads .” Road Diets Losing Width and Gaining Respect, 1999, nacto.org/docs/usdg/road_diets_fixing_big_roads_burden.pdf.

Thomas, Libby. “Road Diet Conversions: A Synthesis of Safety Research.” White Paper Series , 2013, http://www.pedbikeinfo.org/cms/downloads/WhitePaper_RoadDiets_PBIC.pdf.

Welch, T.M. (1999). The conversion of four lane undivided urban roadways to three lane facilities. Prepared for the TRB/ITE Urban Street Symposium, June 28-39, 1999, Dallas, Texas.

ORBT: How Omaha is trying to capture the benefits of light rail at a fraction of the cost

In an age of auto dependency, Omaha is modernizing its bus system to better meet the transportation needs of its residents. Like many other midwestern cities, Omaha has experienced suburban sprawl in the form of low-density development. To combat the inefficiencies of a transit system that serves a low-density, sprawling city, Omaha is implementing its first rapid bus transit line. Known as ORBT (Omaha Rapid Bus Transit), the system includes a number of features to increase both efficiency and rider comfort.

Efficiency and Comfort

The first major improvement of ORBT compared to the standard bus system is the stations. Stations will have a number of features to decrease dwell time and maximize the experience of users as they wait the 10-15 minutes between buses. Based on public input from residents, amenities include maximized weather protection, multiple entrances, integrated technology, and recognizable branding[i]. Metro transit agency officials incorporated this feedback in the design process. Stations are located further apart than normal ones and include raised platforms, decreasing dwell time and increasing efficiency and equity. What really sets the stations apart is the integration of technology. Each station will be equipped with touch screen signs displaying route information in real time. To decrease the inefficiency of fare boxes, riders will be able to either pre pay, or purchase a ticket from a kiosk within the station. Each station will also be equipped with wifi and bike facilities to increase rider comfort.

Proposed ORBT station (Source: http://www.rideorbit.com)

The amenities don’t stop when the riders exit the station. Riders will be able to use their pre purchased ticket at one of three different doors on each ORBT bus, decreasing wait times and allowing the bus to spend less time loading and unloading passengers. Once on the bus, riders will continue to enjoy free wifi and experience both visual and audio cues to alert them of upcoming stops. Cyclists will also no longer be required to store their bikes on the outside of the bus. Instead, bikes can be kept inside the bus, a more user-friendly method.

While the amenities are important, the logistics of the bus system are what set it apart from traditional buses and make it more similar to the coveted light-rail that many cities cannot afford. The core aspect of ORBT are the BAT (business access and transit) lanes that it will operate in. These lanes are reserved for transit vehicles and personal autos entering and exiting businesses. This separate right of way will allow the buses to travel the 8-mile route in 37 minutes compared to 21 in a personal auto. An impressive feat considering the bus stops 6 times along the route. The buses will also take advantage of transit signal priority, extending green lights and reducing the potential for delays.

Articulated ORBT bus (Source: http://www.rideorbt.com)
Economic Development

The benefits of ORBT could extend beyond the actual bus line itself. Officials hope that like light-rail, the ORBT line will act as a catalyst for development. A common criticism of BRT is that it does not incentivize development in the way that light-rail does[ii]. However, a new study from The University of Arizona may help change this opinion. The study examined high quality BRT lines in the early 2000s and found that when done correctly, BRT can have a positive effect on property values and spur development. For example, offices within a quarter mile of the HealthLine in Cleveland rent for prices 18% higher than offices that are not within walking distance of the BRT corridor[iii]. The same can be said for Kansas City and Eugene where rent premiums for office space along BRT corridors are 18% and 12% higher respectively. It is well known that capital investment in quality transit corridors, traditionally light-rail and now bus rapid transit, have been proven to boost economic activity and incentivize development.

Implications for Omaha

The key to ensuring that a BRT system is effective at increasing efficiency, equity, and economic development relies heavily on the planning process. Omaha Metro employees are partnering with the Omaha Planning Department to ensure that these goals will be met. Four planning workshops are scheduled to discuss transit-oriented development near some of the more popular ORBT stations[iv]. Topics like wide sidewalks, landscaping, and pedestrian friendly store fronts have been discussed and identified as important by Derek Miller, the manager of Long-Range Planning department in Omaha. The proposed line is scheduled to open in the spring of 2020 and has an estimated cost of $30 million[v]. Compared to a recent study that estimated the cost of 3-mile long street car system at $170 million, ORBT is a bargain[vi]. Half of the cost of ORBT will be covered by a $14.9 million TIGER grant award by the U.S. DOT with the remainder of the funding coming from federal funds, grants, and generous private donations. The grant, paired with the donations from private entities and in-kind donations from local planning agencies, should result in economic benefits to the city far exceeding the investment.

References

[i] Transit Authority of the City of Omaha. “Smart Tech Streamlined Transit = Stellar Travel.” RideORBT.com. 2019. Accessed March 06, 2019. http://www.rideorbt.com/.

[ii] Schmitt, Angie. “New Evidence That Bus Rapid Transit Done Right Spurs Development.” Streetsblog USA. January 14, 2016. Accessed March 06, 2019. https://usa.streetsblog.org/2016/01/12/new-evidence-that-bus-rapid-transit-done-right-spurs-development/.

[iii] Nelson, Arthur C., and Joanna Ganning. NATIONAL STUDY OF BRT DEVELOPMENT OUTCOMES. Report no. NITC-UU-14-650. Metropolitan Research Center, University of Utah. 1-126.

[iv] Orti, Camila. “City Wants Public’s Input on Development around New ORBT Stations.” KETV. February 22, 2019. Accessed March 06, 2019. https://www.ketv.com/article/city-wants-publics-input-on-development-around-new-orbt-stations/26454334.

[v] Transit Authority of the City of Omaha. “Smart Tech Streamlined Transit = Stellar Travel.” RideORBT.com. 2019. Accessed March 06, 2019. http://www.rideorbt.com/.\

[vi] Nohr, Emily, and Christopher Burbach. “Report Pegs Cost of Omaha Streetcar at $170 Million; Stothert Wants City Vote If Tax Money Is Used.” Omaha.com. March 13, 2018. Accessed March 06, 2019. https://www.omaha.com/news/metro/report-pegs-cost-of-omaha-streetcar-at-million-stothert-wants/article_ddce7e9b-c635-5fc2-b083-18b618d52dbf.html.

Equity and the Future of Transportation in Boston

The average daily commuter traveling to Boston will lose approximately 164 hours to traffic congestion annually when traveling to the city (INRIX, 2018). The city was ranked as having the worst congestion in the nation, topping much larger cities such as Los Angeles and New York. Despite the city’s best efforts to relieve congestion with massive projects like the infamous “Big Dig”, the city is still seeing massive traffic backups and congestion. Along with their traffic problem, Boston has been struggling with their aging transportation system for several years now and a proposed fare increase is on the horizon for Massachusetts Bay Transportation Authority (MBTA) services.

The MBTA runs subway and bus services in the region and is likely the most compelling answer for the region’s future transportation needs. A commission assembled by Gov. Charlie Baker released a vision for the future of transportation in Massachusetts that envisions a system without gas-powered cars, with frequent commuter trains, congestion charges, etc. (Vaccaro, Dec. 15, 2018). The future of transportation in Massachusetts may look bright, but the challenges facing the capacity and efficiency of the system will require careful study and bold initiatives to increase mass transit ridership and decrease traffic congestion. There are a variety of challenges that if unaddressed could be detrimental to current and/or future culture of ridership on the MBTA.

The first, most outright problem for the MBTA is clearly maintenance of the aging system. Frequent delays have been known to plague an already crowded system (Vaccaro, Jan. 31, 2018). An $8 billion plan has been proposed to improve and expand the system back to full repair by 2032 (Vaccaro, Jan. 8, 2019). The planned improvements will inevitably cause service disruptions that have the potential to deplete confidence in the ridership.

Passengers on MBTA (Image Source: Boston Globe)

While there is political and public pressure to improve the MBTA service, there is a now a proposed fare increase that may further strain an increasingly skeptical ridership. Mayor Marty Walsh has already called on the system to improve service before being able to justify a fare increase and a city council member Michelle Wu has called for the system to be entirely free to riders (Sutherland, 2019). The fare increases are expected only to rise by 6.3% across all modes and are justified as keeping up with inflation (MBTA, 2019). The city is fully committed to its goals of reducing congestion and the effects of climate change that will surely be felt in the near future. Gov. Charlie Baker is reluctant to adopt increased gas taxes or implement any sort of congestion tolling that may push more toward public transit and increase ridership, so fare increases on transit is one of few options to increase funding for MBTA services (Vaccaro, Feb. 25, 2019). These increases, paired with the new massive investment, would hopefully incentivize new transit ridership and improve access. But with the new anticipated growth, the system may be facing some equity issues.

Commuter Line Train on Fairmount Line (Image Source: RR Picture Archives)

With plans of repair and expansion, the issue of equity has appeared in many discussions about the future of the MBTA. The line most often cited in this discussion is the Fairmount Line which is currently a commuter line that runs through working-class neighborhoods of Roxbury, Dorchester, Mattapan, and Hyde Park (Seay, 2018). As it stands, the line has seen $200 million in investments to renovate and build new stations, but still suffers from the lowest ridership rates in the commuter system with a small 2,300 riders per day (Seay, 2018). The line is expected to extend in the future to connect to Gillette Stadium to Boston (Vaccaro, Nov. 13, 2017).  While it is admirable to have made such an investment in this transit line, the lack of success may not be for lack of demand for transit services.

Advocates in the area would rather see the Fairmount Line turn into a rapid rail transit system to benefit lower income or working-class residents of the neighborhoods that the train passes through. In 2016, a civil rights investigation was carried out after a series of cancellations on the line (Vaccaro, Sep. 17, 2017). With an extension out to Foxborough, there is a concern the line will never live up to its full potential to serve an already underserved community (Levy, 2017). Trains have a reputation for being utilized by those of higher incomes and typically can diminish bus routes in the areas where lines run (Levinson & Krizek, 2018). This may negatively impact the areas in which the Fairmount Line runs which is already underserved as it is. This is an area of Boston that is already underserved by subway services and transit in general, despite being an area that has more transit-dependent residents. The line could be greatly improved using rapid-transit and would likely see larger ridership rates. Additionally, the fares associated with the commuter line are significantly higher than those for subway services and bus services so a change to rapid transit could benefit residents of the area in this way. This idea of a frequent commuter line has the potential to be a check on equity for the MBTA and set a national standard for commuter rail lines: “If Massachusetts ever does run frequent rail on the Fairmount Line, it could set a national example for similar commuter rail lines. These lines could also use investment in higher frequency, fare integration, and marketing to make them an appealing service for low-income riders” (Levy, 2017).

The line will likely continue to struggle to satisfy arguments on both sides of the issue. There are those who believe that to increase ridership on the line, it must be extended as planned to accommodate more suburban passengers commuting to the city and those who believe that increased frequency of the train is the key to increased ridership numbers. With increased frequency, holding all else constant, there is a predicted increase in ridership (Levinson & Krizek, 2018). This would serve to support advocates for rapid transit, but it should also be considered that an extension of commuter service with similar frequency may also reduce the congestion that strains Boston’s roadways during commuting times. Opportunity for the most transit-dependent residents of the city may boost ridership on the line, but if a compromise on extensions can be made, the line could also service the city’s goal of reducing congestion. The future of the MBTA seems uncertain, but there is significant political will and financial backing for the necessary improvements for the system. As with any infrastructure project of this scale, the way in which growth happens should take into account equity and access issues into growth to realize full success.

Works Cited

Image Sources:

Active Transportation Connections Toward Improved Community Health in Newton, Iowa

As of 2017, the State of Iowa has the fifth highest adult obesity rate and the sixteenth highest youth obesity rate in the United States.[i] Initiated by the Rockefeller Foundation and the former Iowa Governor and U.S. Secretary of Agriculture Tom Vilsack, the Newton Community Health Project brings together the University of Iowa, Grinnell College, and the City of Newton, Iowa to explore obesity prevention and community health promotion.

In an initial project meeting with community stakeholders from Newton, the need for greater sidewalk and trail connectivity and active recreation attractions was identified. The City of Newton has also recognized this need and devotes considerable attention to the topic of pedestrian and bicyclist connectivity in both its 2016 Comprehensive Plan[ii] and 2017-2019 Action Plan.[iii] In particular, Newton seeks to address these connectivity gaps to improve their initiatives in areas of walking and biking, community supported education, access to parks and trails, pedestrian safety and connections, bike safety, and handicapped accessibility.[iv] Additionally, the City seeks to ensure that the trails and sidewalks are attractive to all users and that they complete a looped route to all parks and other destinations, such as schools, shopping, eating, and resting.[v] Supported by recommendations from the Center for Disease Control and Prevention, Newton’s focus on active transportation through walking or biking and other travel policies and practices, such as sidewalks, bicycle lanes, and multiuse trails, are all vetted and effective strategies to prevent obesity and other chronic diseases.[vi]

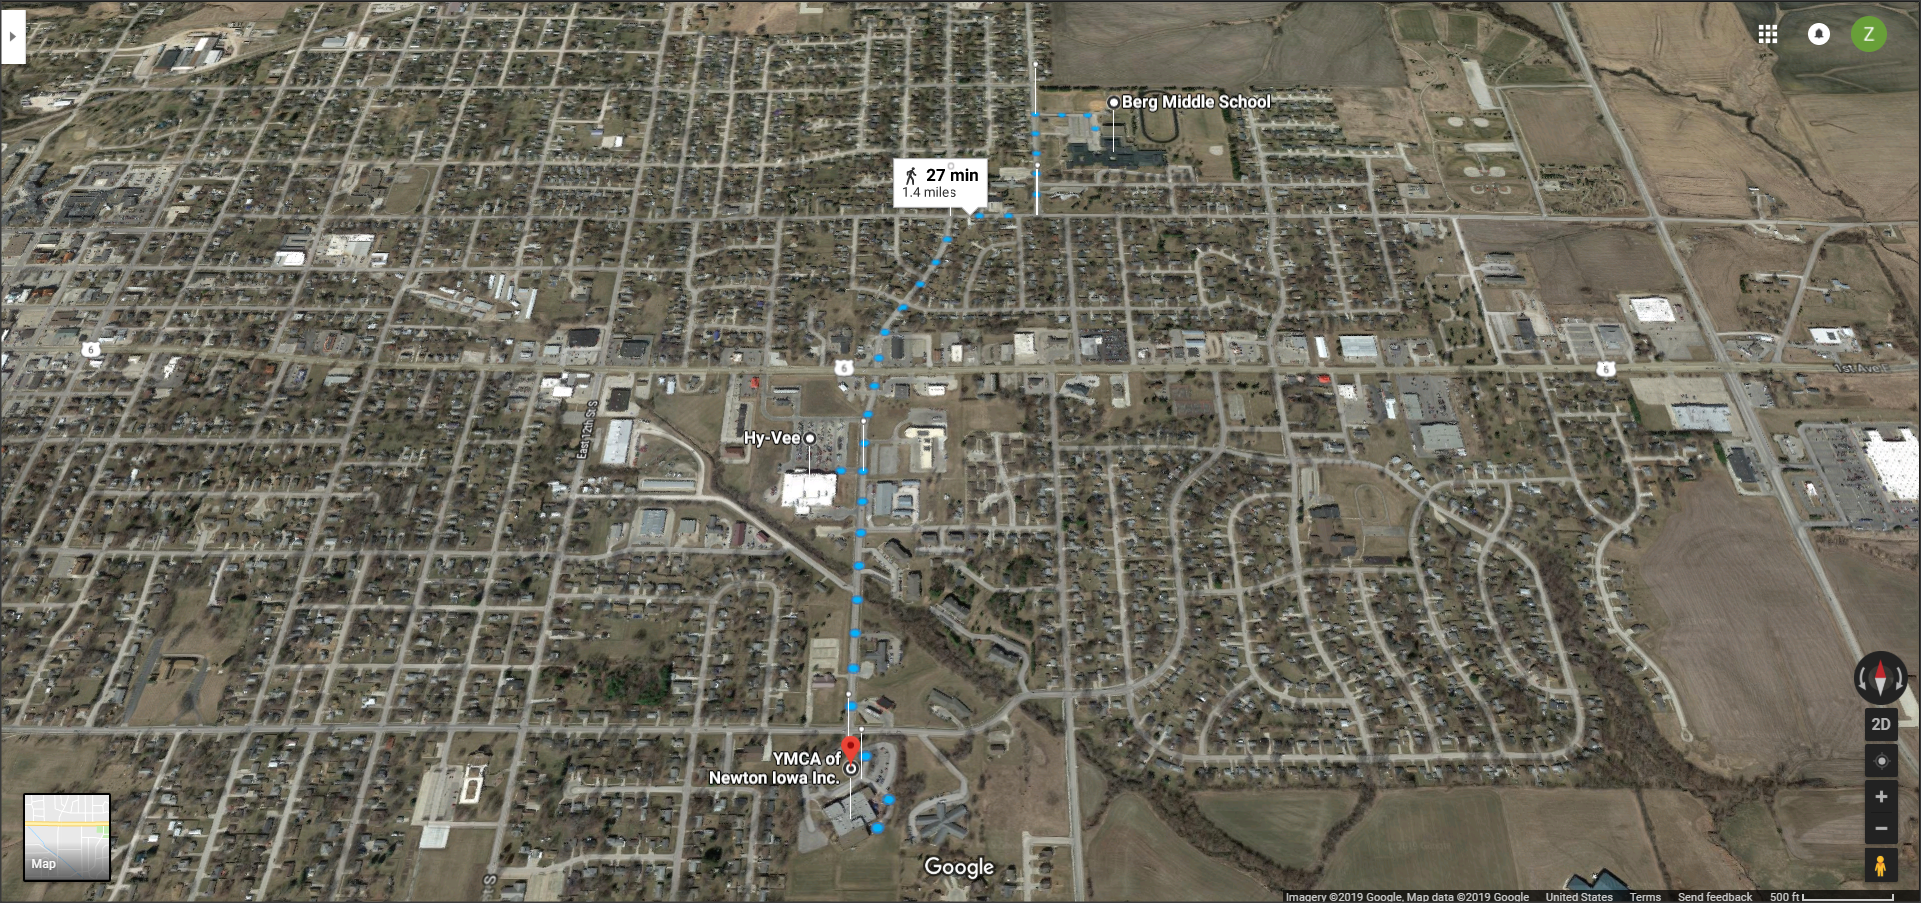
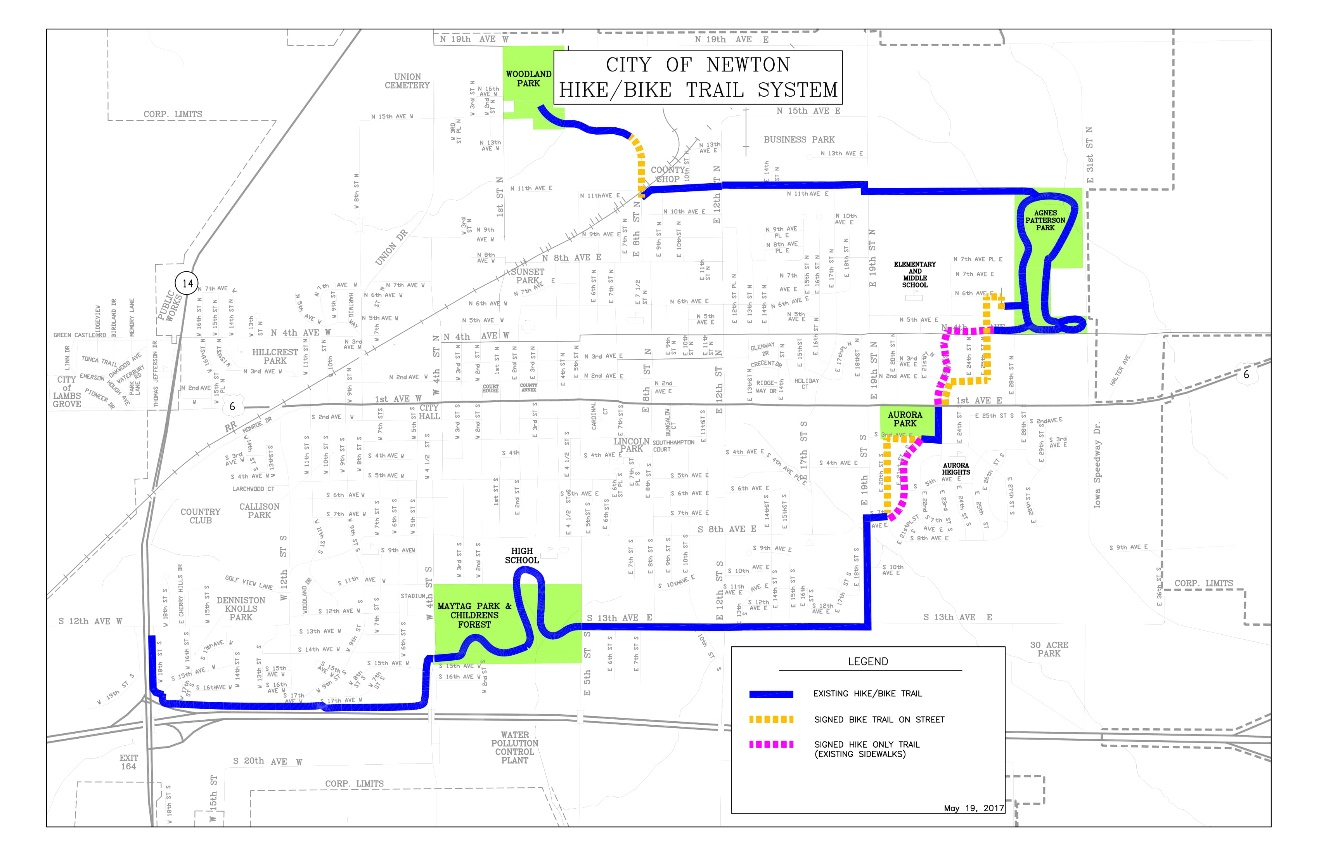
Tying together the topics of active transportation through walking and biking with network connectivity to promote community health, neighborhood walkability is often the first place to begin identifying and prioritizing specific corridors for further interventions.[vii] After analyzing Newton’s street network for missing sidewalk connections that could impair neighborhood walkability, the route from the newly expanded Berg Middle School south to the HyVee, and ending at the YMCA presents an opportunity for improvement. Currently, Newton’s existing Hike and Bike Trail System is disconnected from forming a complete loop and only exists on the fringe areas of Newton. Community stakeholders have noted that destinations should be incorporated within the existing hiking and biking networks. By incorporating Berg Middle School, HyVee, and the YMCA as destinations along the Hike and Bike Trail, the Trail can expand its attractiveness and utility for users, especially for parents and students.

Google Maps Route

The route from Berg Middle School, passing through the HyVee, and ending at the Newton YMCA. Source: Google Maps

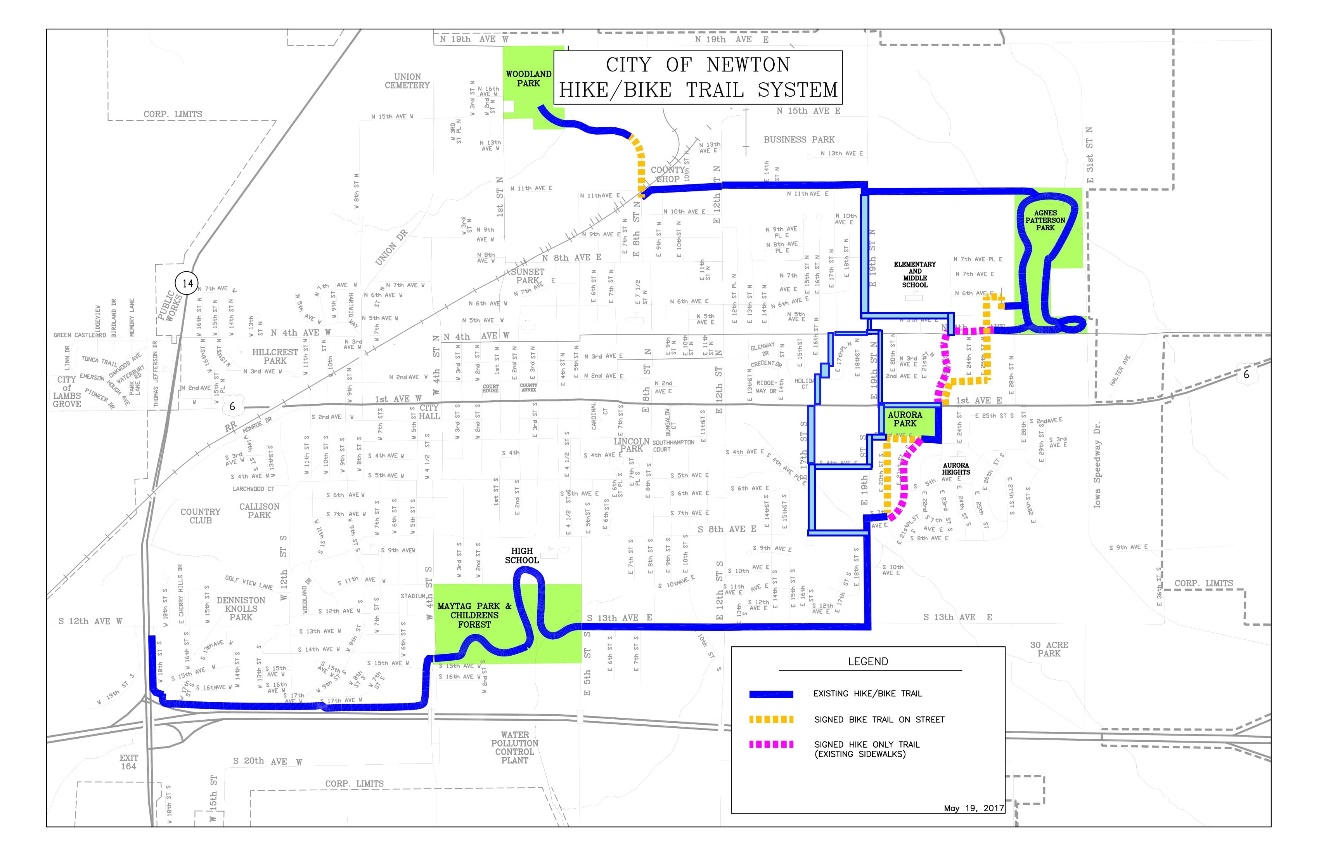
Newton Existing Hike and Bike Trail System

City of Newton’s existing Hike and Bike Trail System. Source: City of Newton

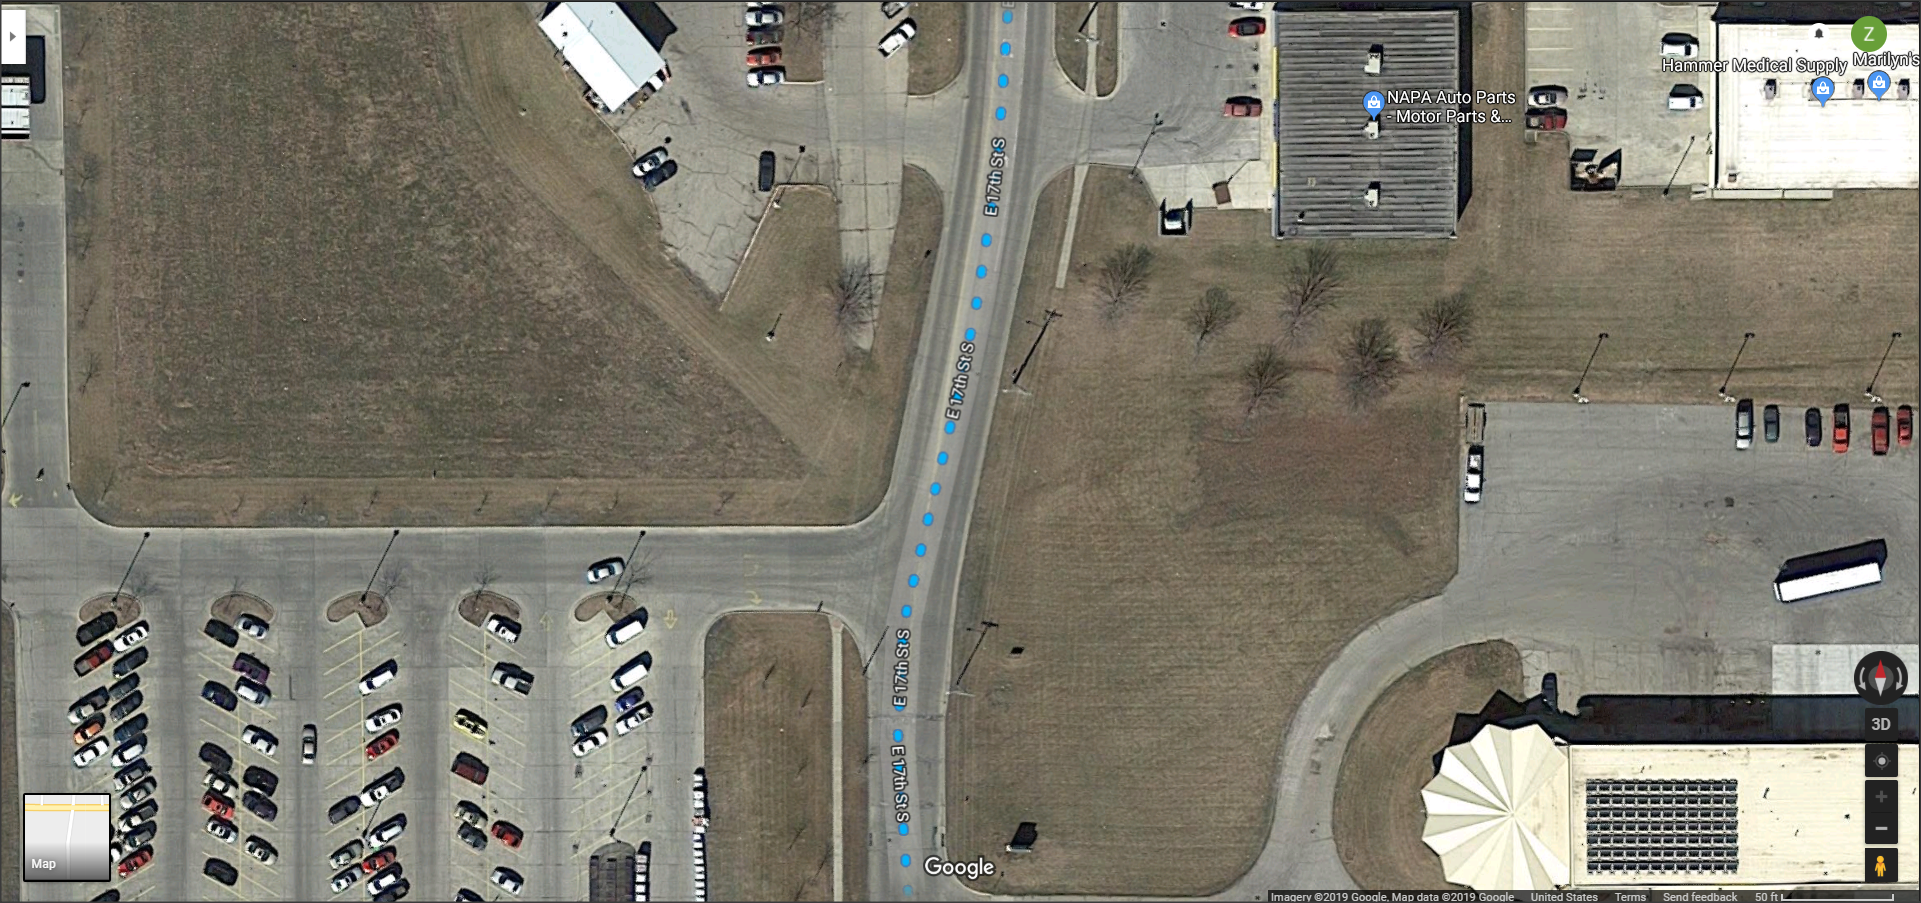
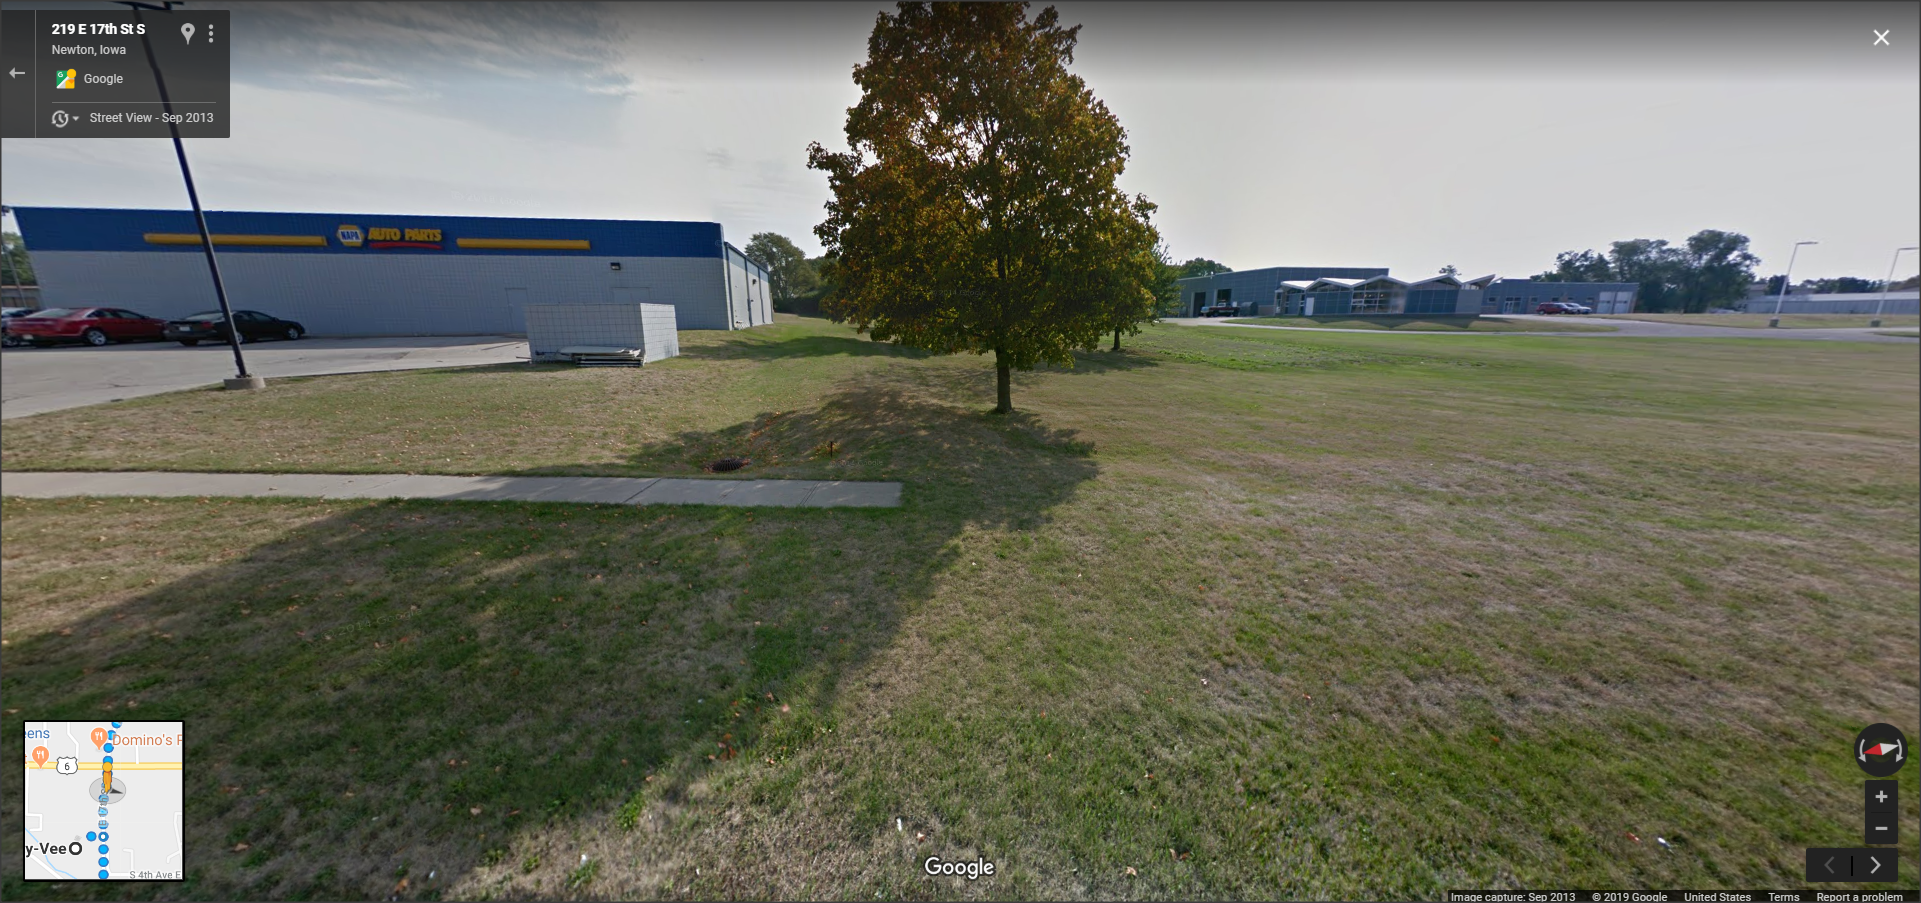
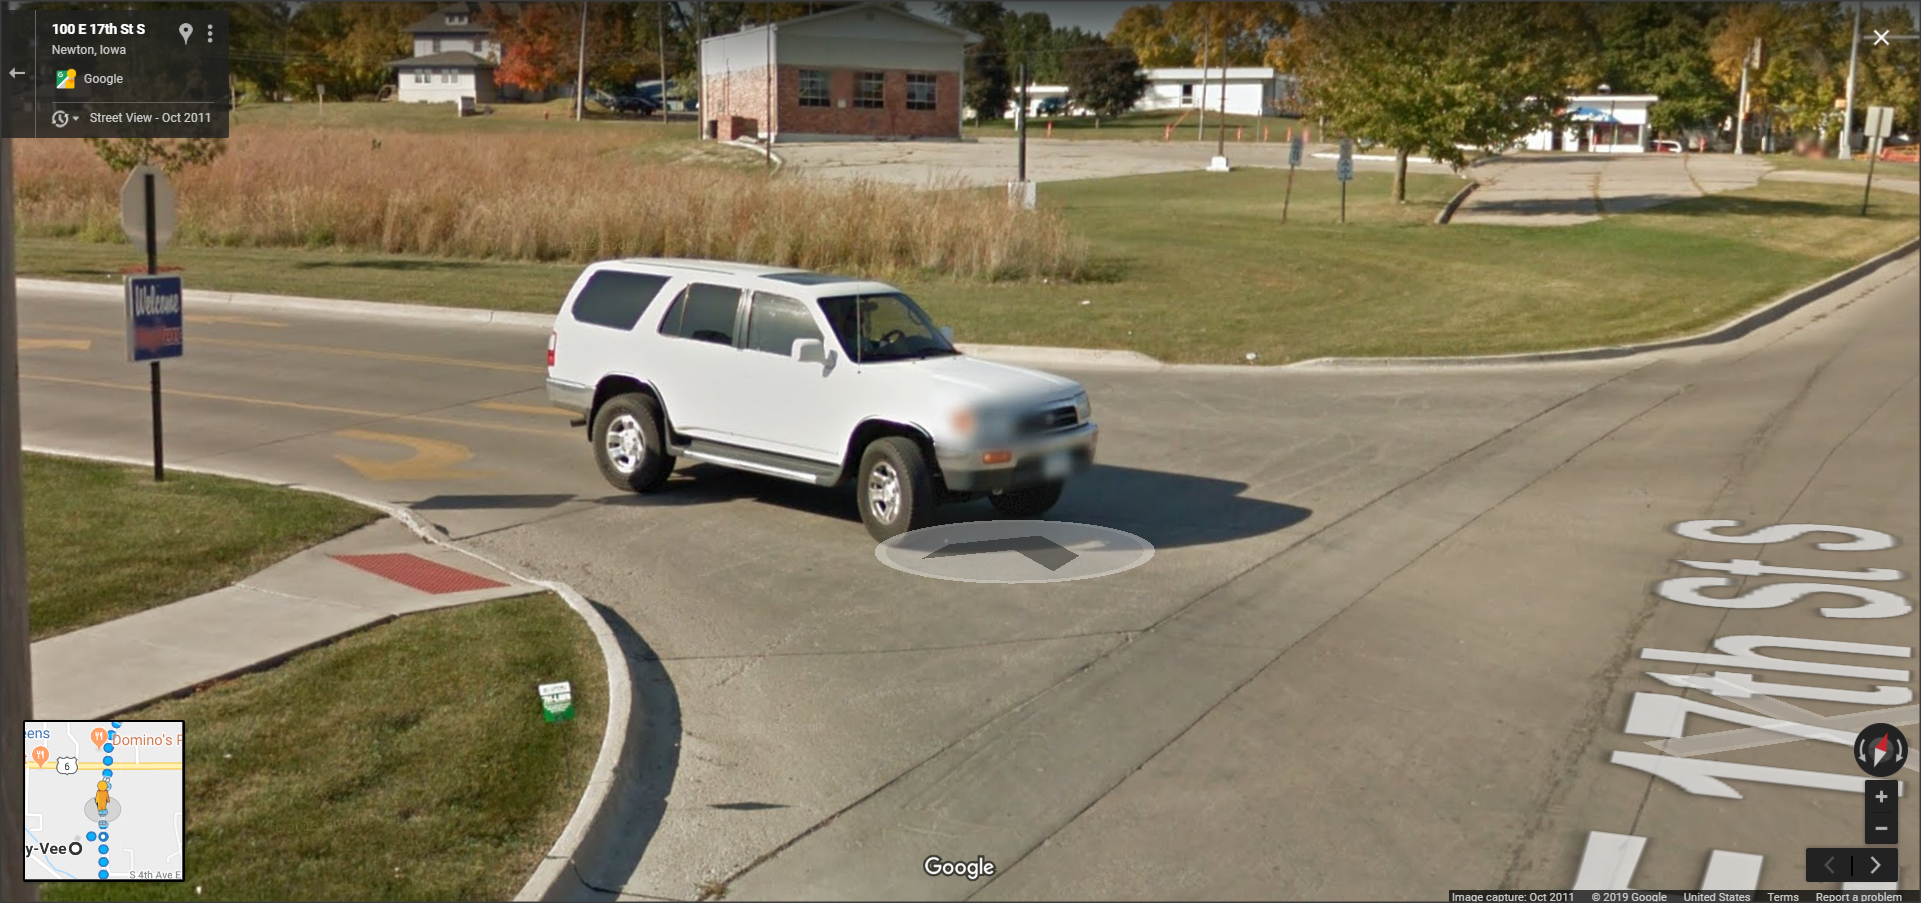
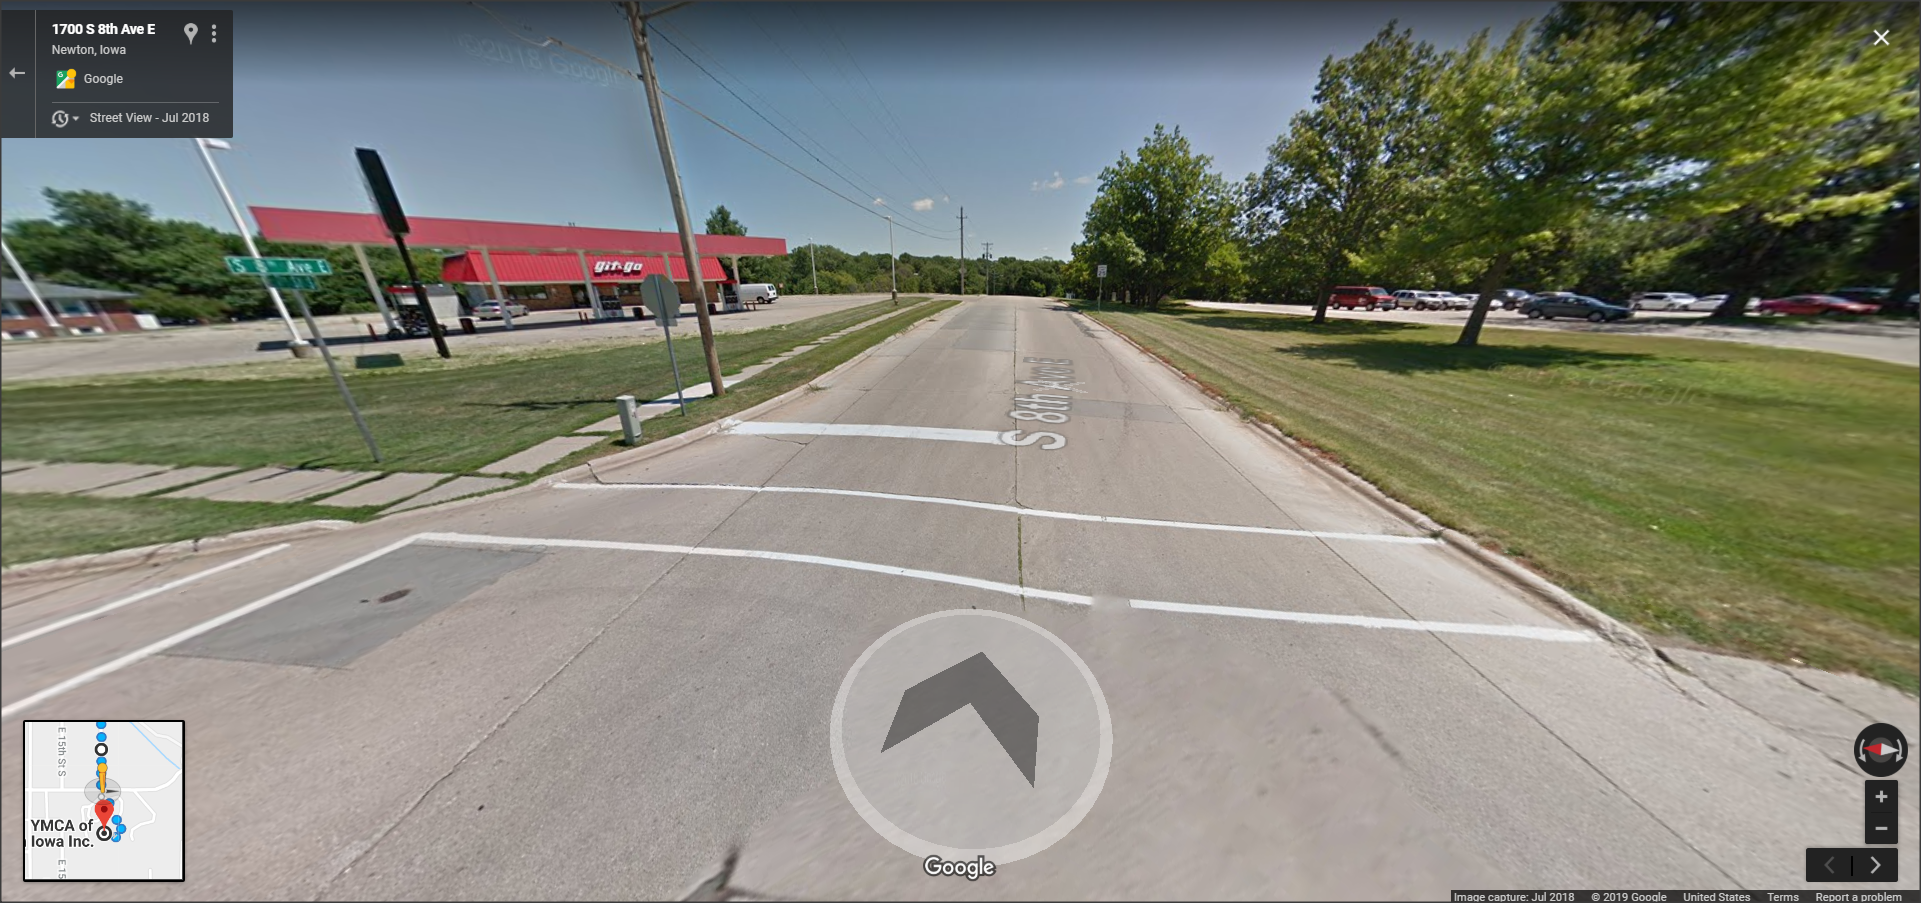
However, the current route connecting the three identified locations is missing sidewalk connections that are hindering active transportation. The first missing connection is in front of the HyVee where the western sidewalk does not extend all the way north and where the eastern sidewalk does not extend all the way south.

Missing Connection 1 Overview

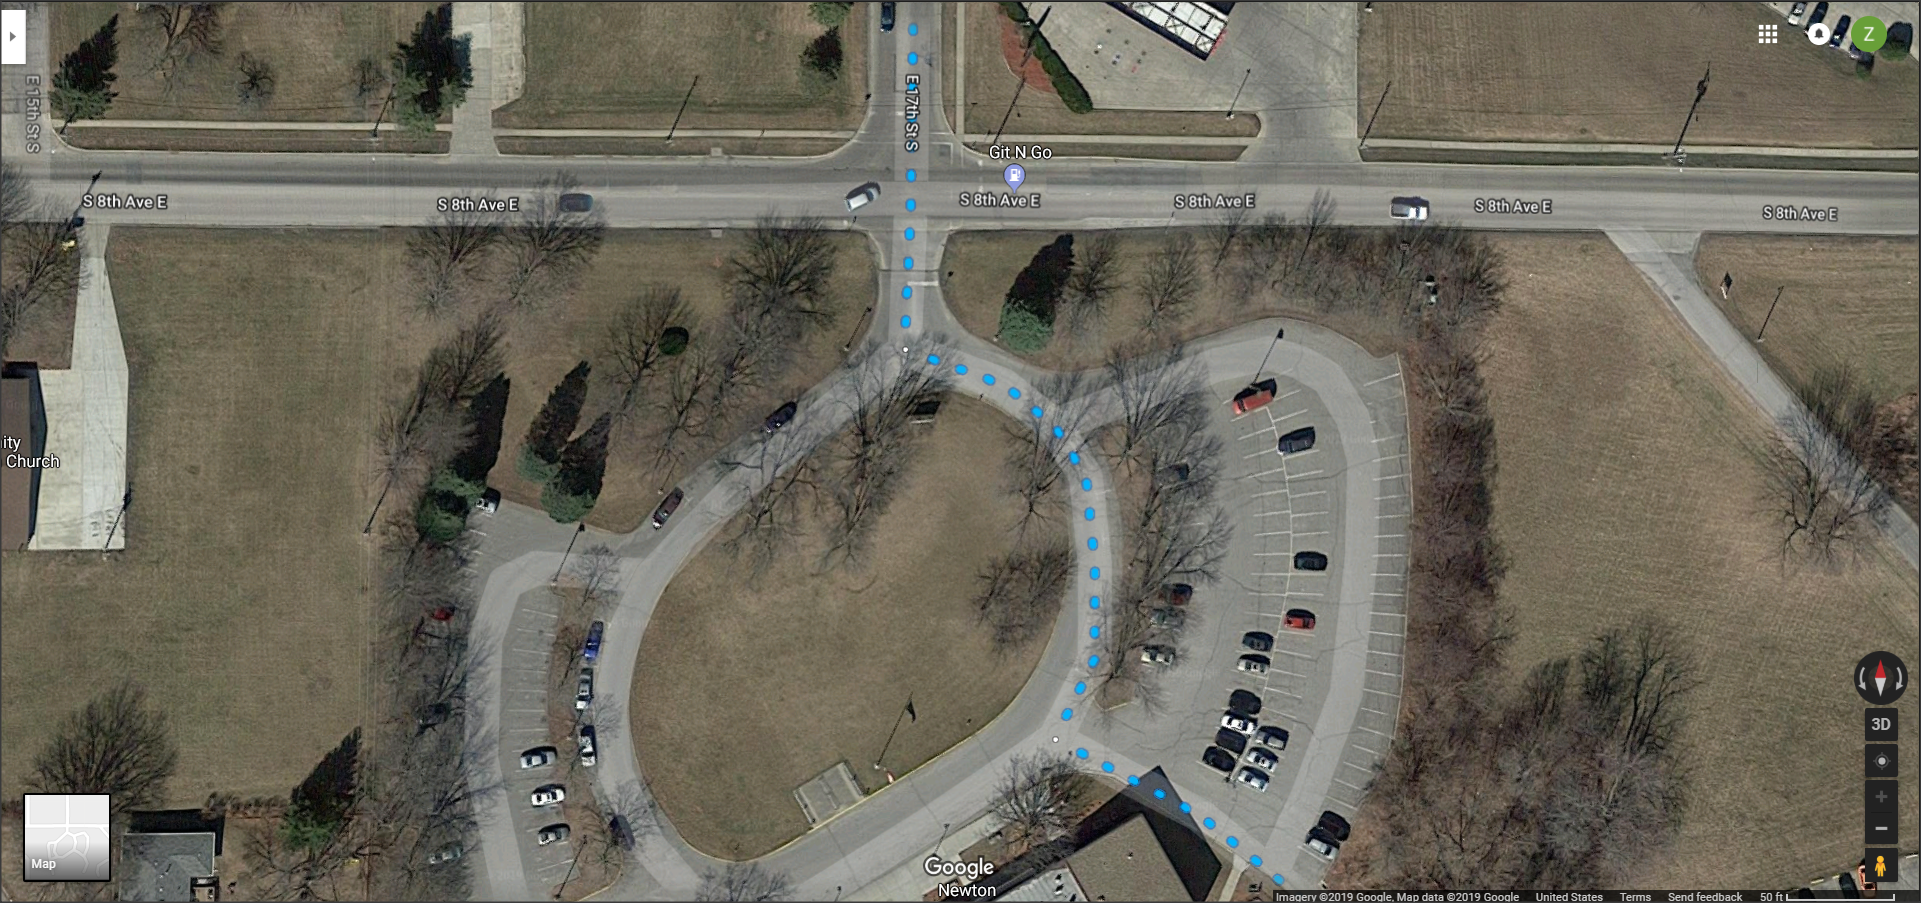
Aerial view of the first section of the route missing sidewalk connections in front of the HyVee. Source: Google Maps

Missing Connection 1 East

Street view of the missing eastern sidewalk. Source: Google Maps

Missing Connection 1 West

Street view of the missing western sidewalk. Source: Google Maps

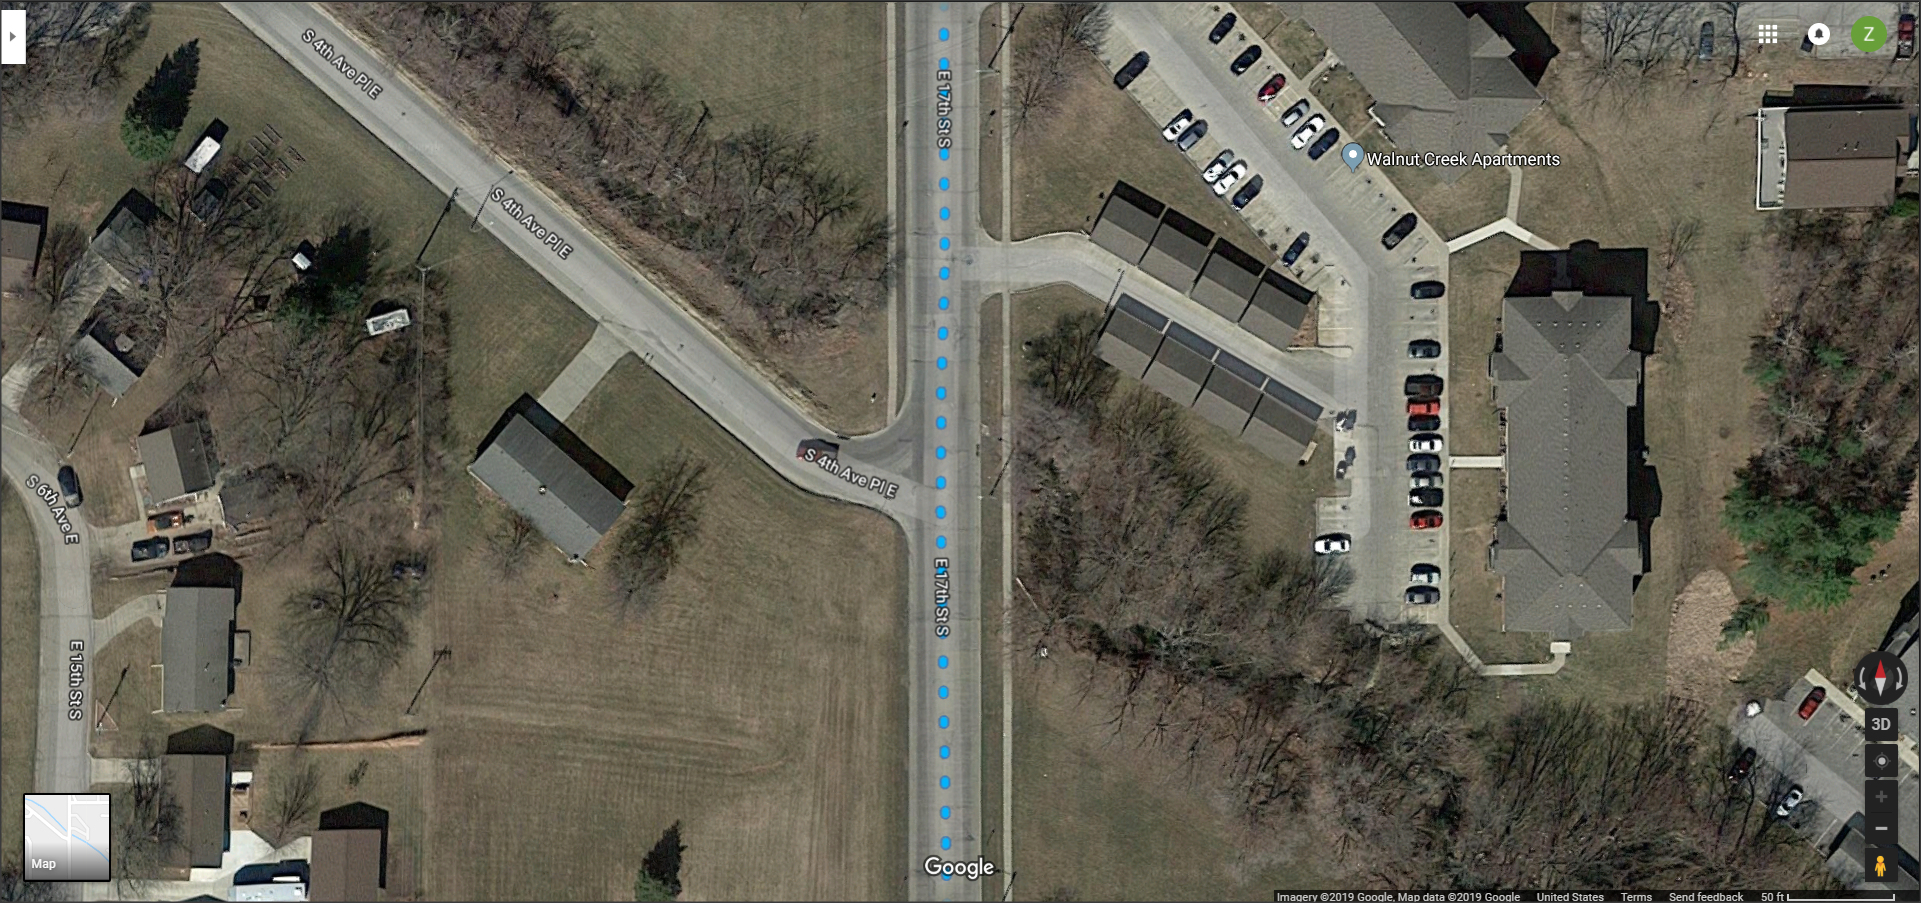
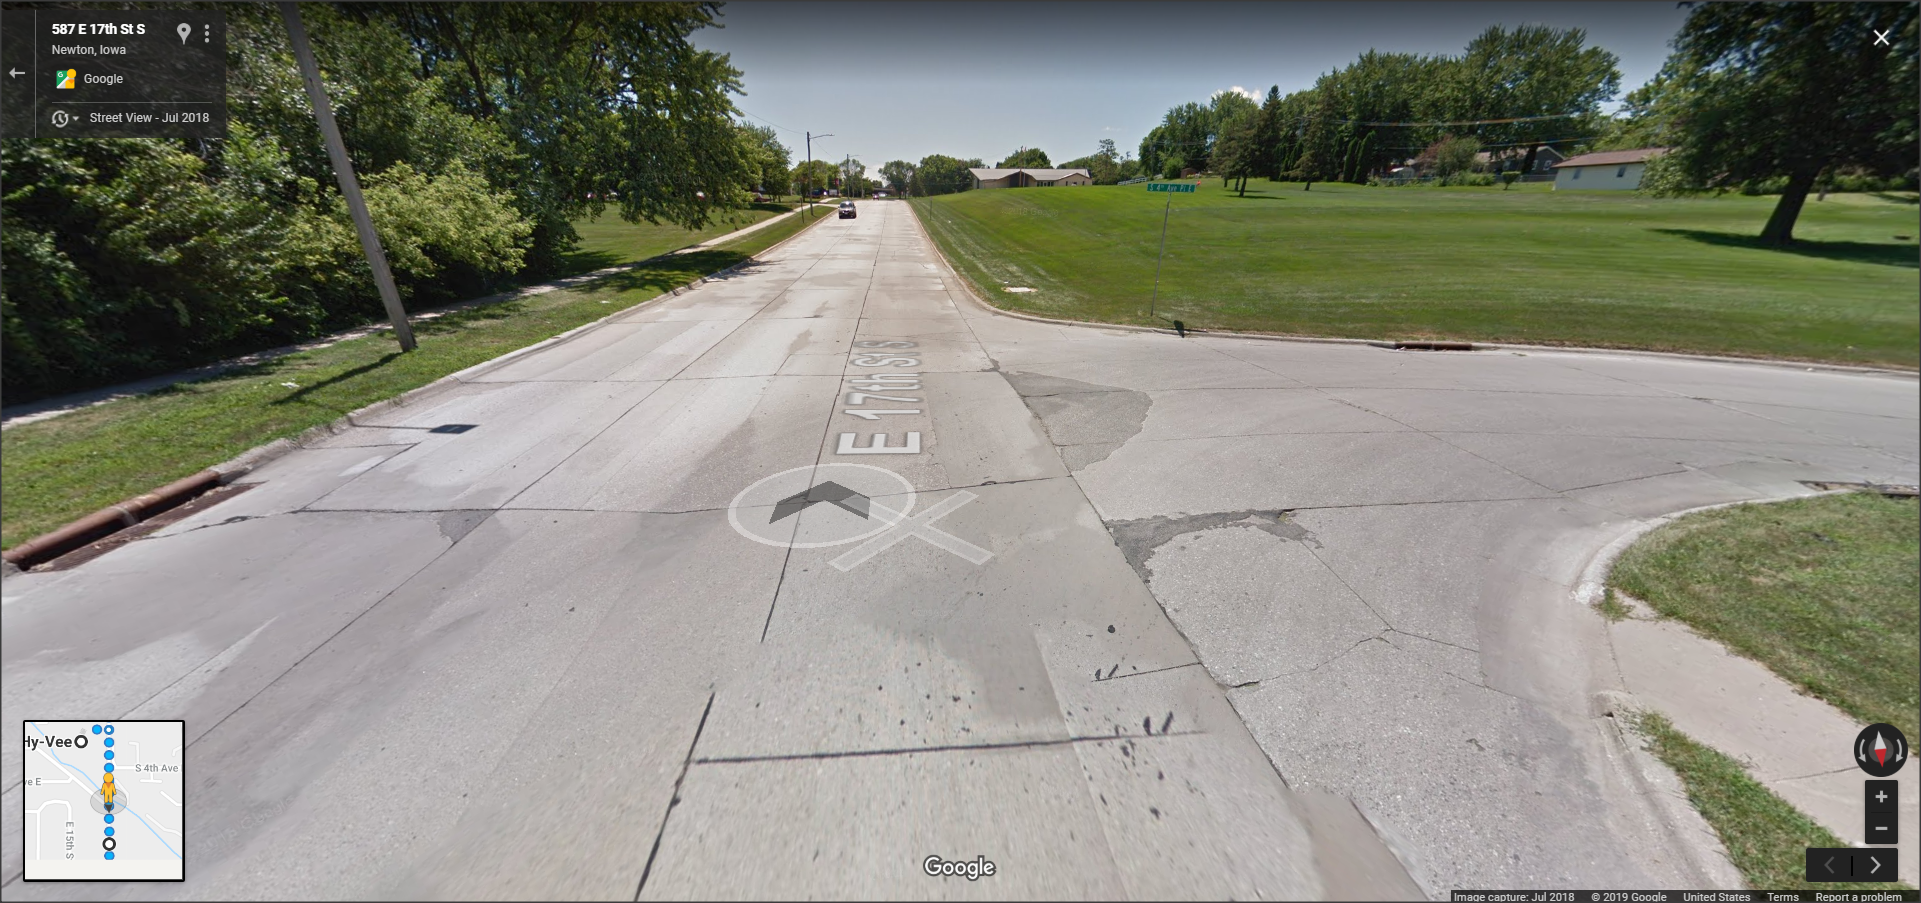
The second missing connection is a little further south from the HyVee and where the western sidewalk does not extend all the way south.

Missing Connection 2 Overview

Aerial view of the second section of the route missing sidewalk connection. Source: Google Maps

Missing Connection 2 West

Street view of the missing western sidewalk. Source: Google Maps

The third missing connection is in front of the YMCA where the western sidewalk is missing completely, and the eastern sidewalk does not continue south to the front entrance of the YMCA building but instead stops abruptly at the lawn and driveway entrance.

Missing Connection 3 Overview

Aerial view of the third section of the route missing sidewalk connection. Source: Google Maps

Missing Connection 3 East

Street view of the missing eastern sidewalk. Source: Google Maps

Individual transportation modes are often formed from habit and influenced by upbringing, personal preferences, and individual tolerance for inconvenience.[viii] Since the route connecting Berg Middle School, the HyVee, and the YMCA lacks full sidewalk connectivity and bicyclist infrastructure, people are likely to be prohibited from walking or biking along the route that connects these community destinations. As a result, these built environment barriers prompt residents to resort to driving in their automobiles to access these facilities or to avoid using these facilities completely because of the lack of access. Improving the sidewalk and bicycle connections between the three destinations and then connecting them to the existing Hike and Bike Trail would not only improve walking and biking access to those facilities but also enhance the Hiking and Biking Trail by adding destinations for shopping and recreation. A new route, colored in light blue in the map below, should be proposed. The route has an additional benefit of shortening the Hiking and Biking Trail, consistent with Newton’s Comprehensive Plan to provide shortcuts so that users can choose not to complete the entire trail loop.[ix]

Newton Proposed Hike and Bike Trail System

Proposed addition, in light blue, to Newton’s existing Hike and Bike Trail System. Adapted from City of Newton.

While this proposal addresses several of the Newton community stakeholders’ comments and the Comprehensive Plan’s and Action Plan’s goals, there are still more areas for additional intervention. To complement the addition of sidewalks to support active transportation, the route would also benefit from several design improvements. As it stands, the route does not adhere much to either the General Theory of Walkability[x], which measures whether walks are useful, safe, comfortable, and interesting, nor the eight qualities of good urban design[xi], which measures imageability, enclosure, human scale, transparency, complexity, coherence, legibility, and linkage. Next steps for the project would to be investigate how urban design solutions could enhance active transportation along the route, such as the provision of more street trees to provide shade during the summer and to act as a barrier for cyclists and pedestrians.

[i] Trust for America’s Health and Robert Wood Johnson Foundation. “The State of Obesity: Better Policies for a Healthier America 2018.” Washington, D.C. and Princeton: Trust for America’s Health and Robert Wood Johnson Foundation, 2018. https://stateofobesity.org/wp-content/uploads/2018/09/stateofobesity2018.pdf.

[ii] The City of Newton. “Newton’s Future: A Comprehensive Plan.” Newton: The City of Newton, 2016. https://www.newtongov.org/DocumentCenter/View/867/Newtons-Future-A-Comprehensive-Plan?bidId=.

[iii] The City of Newton. “2017-2019 Action Plan.” Newton: The City of Newton, 2016. https://www.newtongov.org/DocumentCenter/View/2295/2017-2019-Action-Plan?bidId=.

[iv] The City of Newton. “Newton’s Future: A Comprehensive Plan.” Newton: The City of Newton, 2016. https://www.newtongov.org/DocumentCenter/View/867/Newtons-Future-A-Comprehensive-Plan?bidId=.

[v] The City of Newton. “Newton’s Future: A Comprehensive Plan.” Newton: The City of Newton, 2016. https://www.newtongov.org/DocumentCenter/View/867/Newtons-Future-A-Comprehensive-Plan?bidId=.

[vi] Centers for Disease Control and Prevention. “Strategies to Prevent Obesity and Other Chronic Diseases: The CDC Guide to Strategies to Increase Physical Activity in the Community.” Atlanta: U.S. Department of Health and Human Services; 2011. https://www.cdc.gov/obesity/downloads/PA_2011_WEB.pdf.

[vii] Lawrence D. Frank, James F. Sallis, Terry L. Conway, James E. Chapman, Brian E. Saelens, and William Bachman. “Many Pathways from Land Use to Health: Associations between Neighborhood Walkability and Active Transportation, Body Mass Index, and Air Quality.” Journal of the American Planning Association 72:1, 75-87.

[viii] David M. Levinson and Kevin J. Krizek. Planning for Place and Plexus: Metropolitan Land Use and Transport. New York: Routledge, 2008. Pg. 97.

[ix] The City of Newton. “Newton’s Future: A Comprehensive Plan.” Newton: The City of Newton, 2016. https://www.newtongov.org/DocumentCenter/View/867/Newtons-Future-A-Comprehensive-Plan?bidId=.

[x] Jeff Speck. Walkable City Rules: 101 Steps to Making Better Places. Washington, D.C.: Island Press, 2018. https://doi.org/10.1080/01944360608976725.

[xi] Reid Ewing and Keith Bartholomew. Pedestrian & Transit-Oriented Design. Urban Land Institute and American Planning Association: Washington, D.C. 2013.